
It's the holiday season, so we hope your spirits are up.
Local real estate stats, however, are down.
While it's a story we've told a lot recently, we have some new numbers to review here as we are quite nearly at year-end.
First, something not terribly shocking: New pending sales for the first half of…
It's the holiday season, so we hope your spirits are up.
Local real estate stats, however, are down.
While it's a story we've told a lot recently, we have some new numbers to review here as we are quite nearly at year-end.
First, something not terribly shocking: New pending sales for the first half of December were few in number, with just 5 new contracts secured citywide over 14 days.
That's not a huge outlier, though. Out of the prior 9 years, it was more common than not to have new pendings in the single digits. In 5 out of 9 years, we saw fewer than 10 deals in this 2-week window of time, with 6-7 each year from 2016-18, and only 5 at this time last year, too.
So, not a huge indicator, but also, not really good news, either.
Where are all those bargain hunters and sellers willing to make a deal?
We'll note that the new deals included two lots in East Manhattan (1658 Ruhland and 1306 Voorhees) and a lower-priced remodel at 1008 Rosecrans (asking $1.699M), but also two bigger sales on the East side and in the Trees: 1300 11th (new construction asking almost $5M) and a stylish flipper remodel at 625 33rd (asking $3.700M).
(These are all listings on the MLS, not listings by Dave Fratello and Edge. Please click on any address to get full info about any property.)
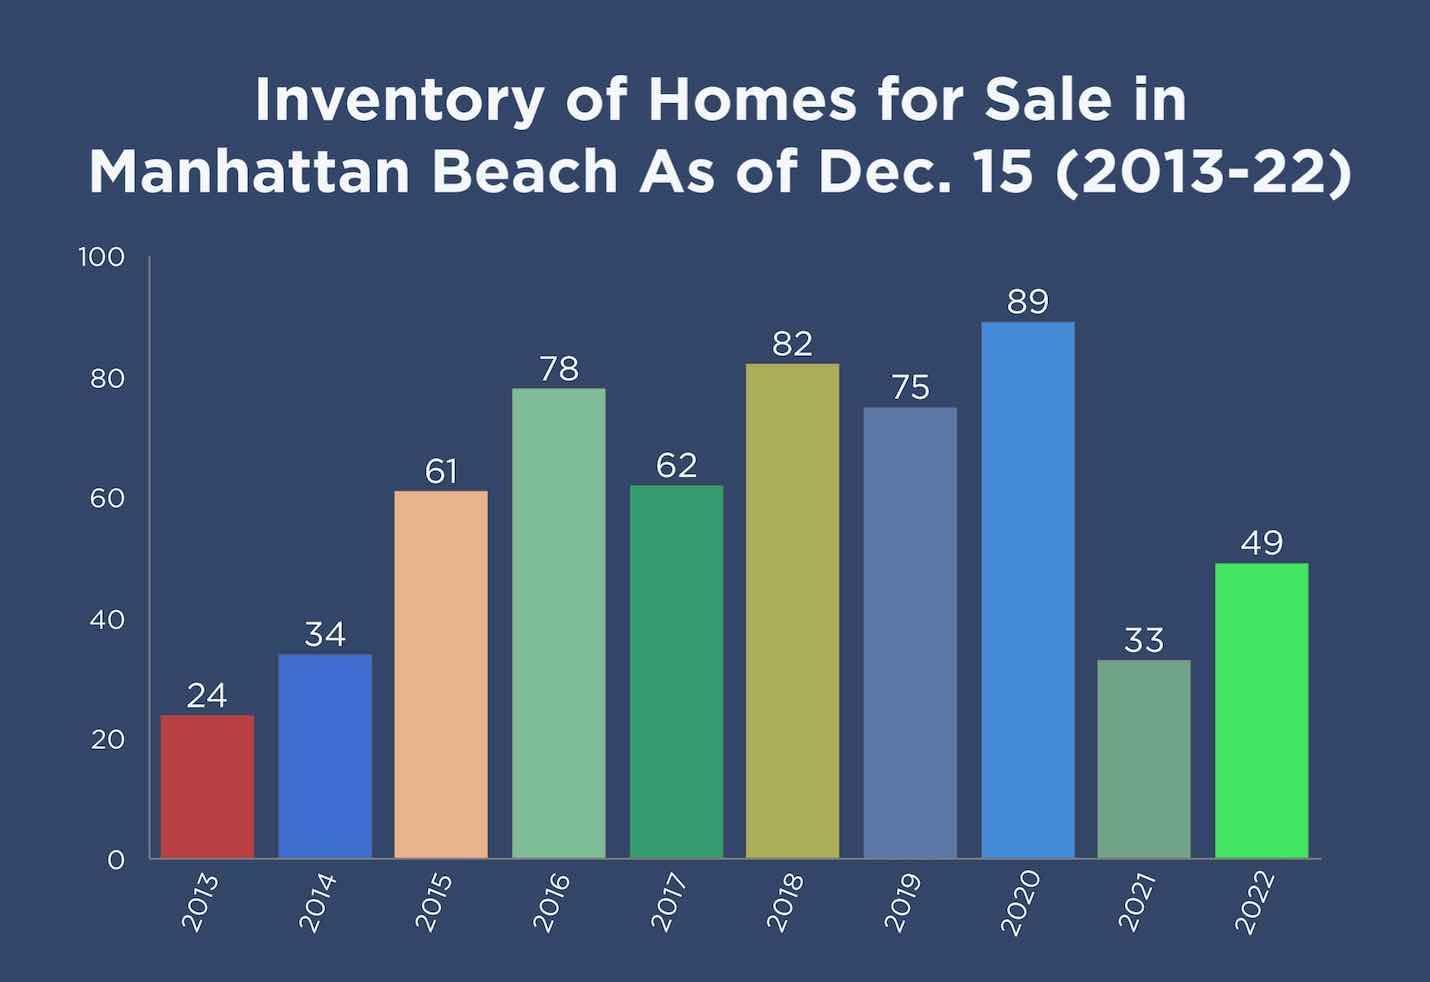 Inventory always drops at this time of year, and in fact we saw 12 fewer listings in mid-December than at month's start, with just 49 on market.
The whole year 2022 has felt anemic with regard to inventory in Manhattan Beach, but we're sitting on a virtual flood of listings now compared with this time last year, when we had only 33. (It's a 48% increase!)
Last year's late-year dropoff in homes for sale clearly set the stage for this year's supply problem, so perhaps the little bump up is a green shoot? (Nice try.)
As you can see from our chart, these past two years pale in comparison to late-in-the-year inventory from every recent year from 2015-present.
Last time the numbers were so low, near year end in 2013 and 2014, it kind of felt like MB had "sold out," everyone was so exhausted from all the real estate activity.
Right now? Not so much.
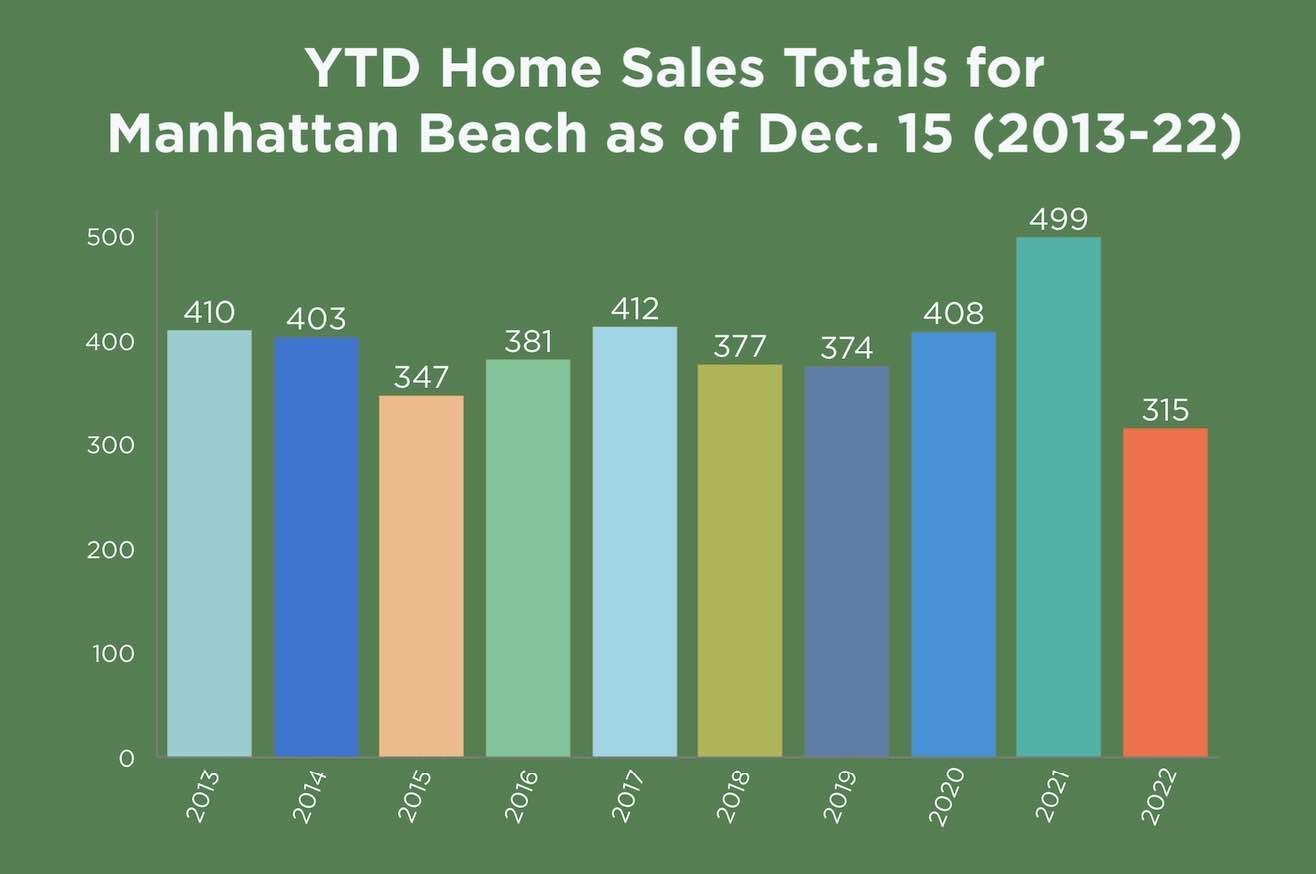 Take a look at year-to-date sales.
There's no year in the past 10 other than right here, right now in 2022, that was below about 350 sales at this time of year, with many nearer to 400 sales.
But 2022 is sitting at just 315 sales from Jan. 1-Dec. 15. (There are 15 properties in escrow now in MB.)
It's obviously a giant drop from last year's 499 at this time, but that's to be expected. What's shocking is how far off the normal pace this year is.
We did some further digging, and only one year in the last 20 was lower: the bubble-pop year of 2008, with 295 sales as of Dec. 15.
As a savvy, regular reader of MB Confidential, you aren't surprised by much of this. We've been pointing to the same three problems (triple-demic?) for much of the year:
- low inventory,
- slower sales pace (especially as rates rose) and
- fewer overall sales.
We gave you even more data with rolling sales totals in a post one month ago ("Data Show Drop in Sales, Suggest Bounceback"). There, we basically concluded that next year has to be better, because every other year has been better.
Not everyone sees things that way, however. We'll have more data for you in the last part of 2022 and into Jan. 2023, pulling from lots more sources and pulling in more predictions.
If we don't meet before the holidays, here's to you and yours having a great season.
--------------------------------------------------------
Here's the rest of our local real estate market update report for the period ending 12/15/22:
> 49 active listings as of 12/15/22 (-12 from 11/30/22)
> 38 SFRs (-10)
> 11 THs (-2)
See the Inventory list as of 12/15/22 here, or see the MB Dashboard for up-to-the-minute data.
Active listings by region of Manhattan Beach in this report:
> Tree Section: 9 actives (+1)
> Sand Section: 24 actives (-6)
> Hill Section: 9 actives (-2)
> East MB: 7 (-5)
We're also providing a report on closed sales by region of MB
Sales data, including PPSF for all properties, are organized by sub-region of Manhattan Beach.
Here's a link to the spreadsheet: "MB Pending/Sold as of 12/15/22".
Please see our blog disclaimer.
Listings presented above are supplied via the MLS and are brokered by a variety of agents and firms, not Dave Fratello or Edge Real Estate Agency, unless so stated with the listing. Images and links to properties above lead to a full MLS display of information, including home details, lot size, all photos, and listing broker and agent information and contact information.


