Rocket up, slide down.
That was the story of sales volume in Manhattan Beach real estate these last couple of years.
An incredible burst of home sales activity drove the number of sales over 500 in 2021 (to 518), and the dollar volume spent on homes over $3.5 billion.
Then 2022 saw a nearly continuous…
Rocket up, slide down.
That was the story of sales volume in Manhattan Beach real estate these last couple of years.
An incredible burst of home sales activity drove the number of sales over 500 in 2021 (to 518), and the dollar volume spent on homes over $3.5 billion.
Then 2022 saw a nearly continuous slide downward, month by month.
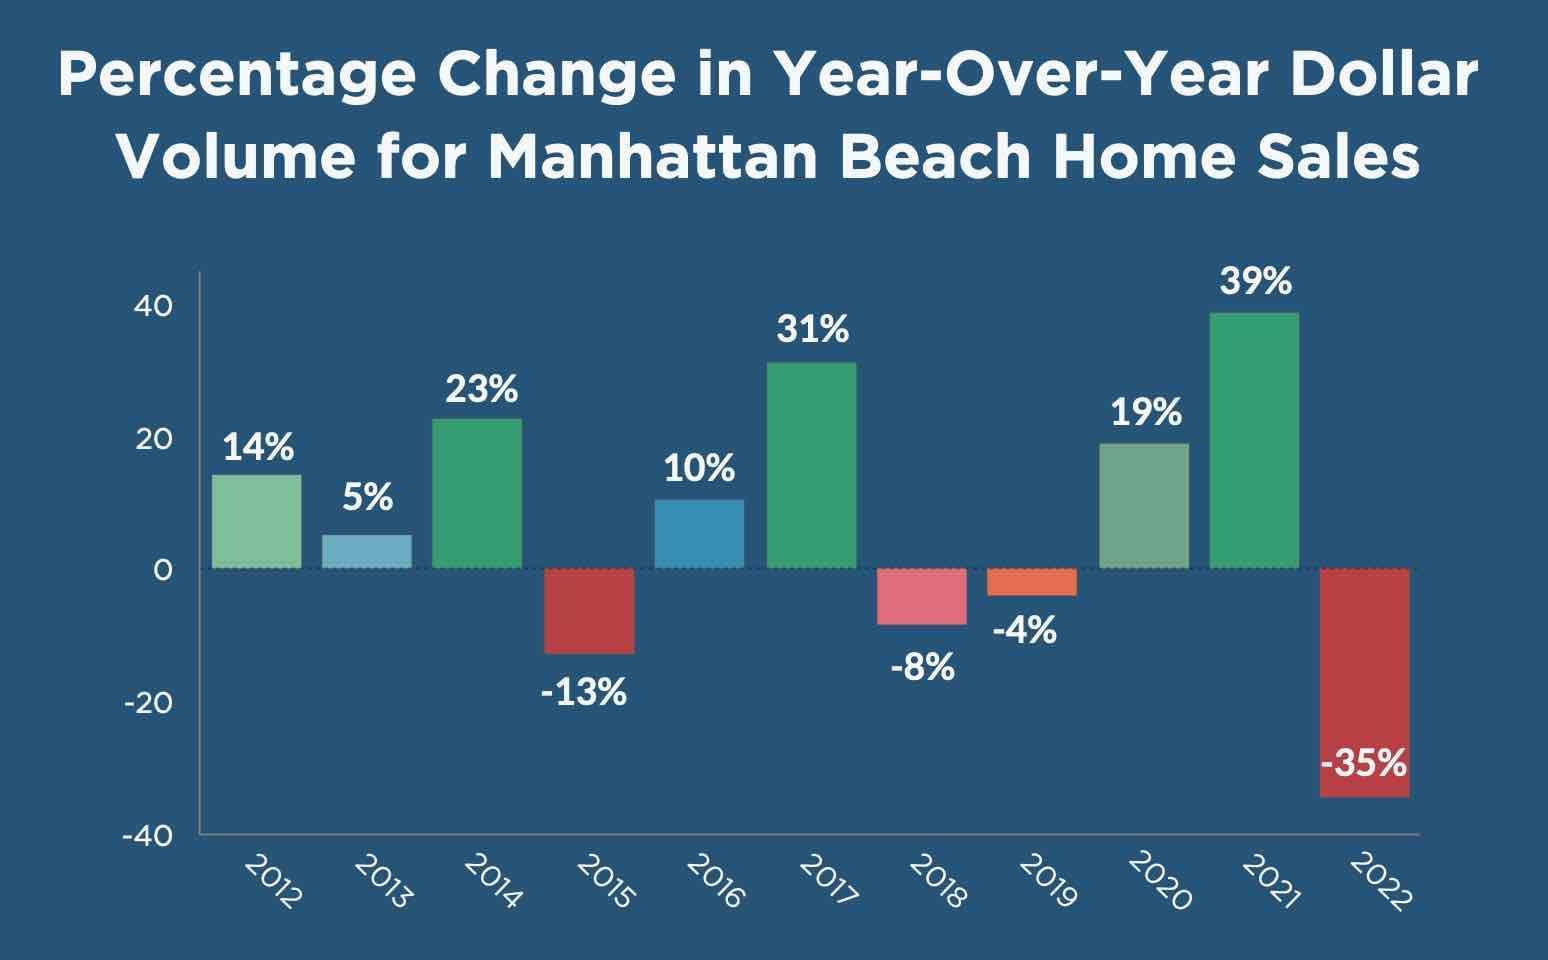
As we close the books on 2022 data, there were 38% fewer sales (322) than the year before, and dollar volume fell by $1.230 billion to $2.324 billion (-35%).
We had to really work on that first chart above to make room to show the 35% decline. Nothing like that had happened recently. Below is a look at dollar volume on a month by month basis.
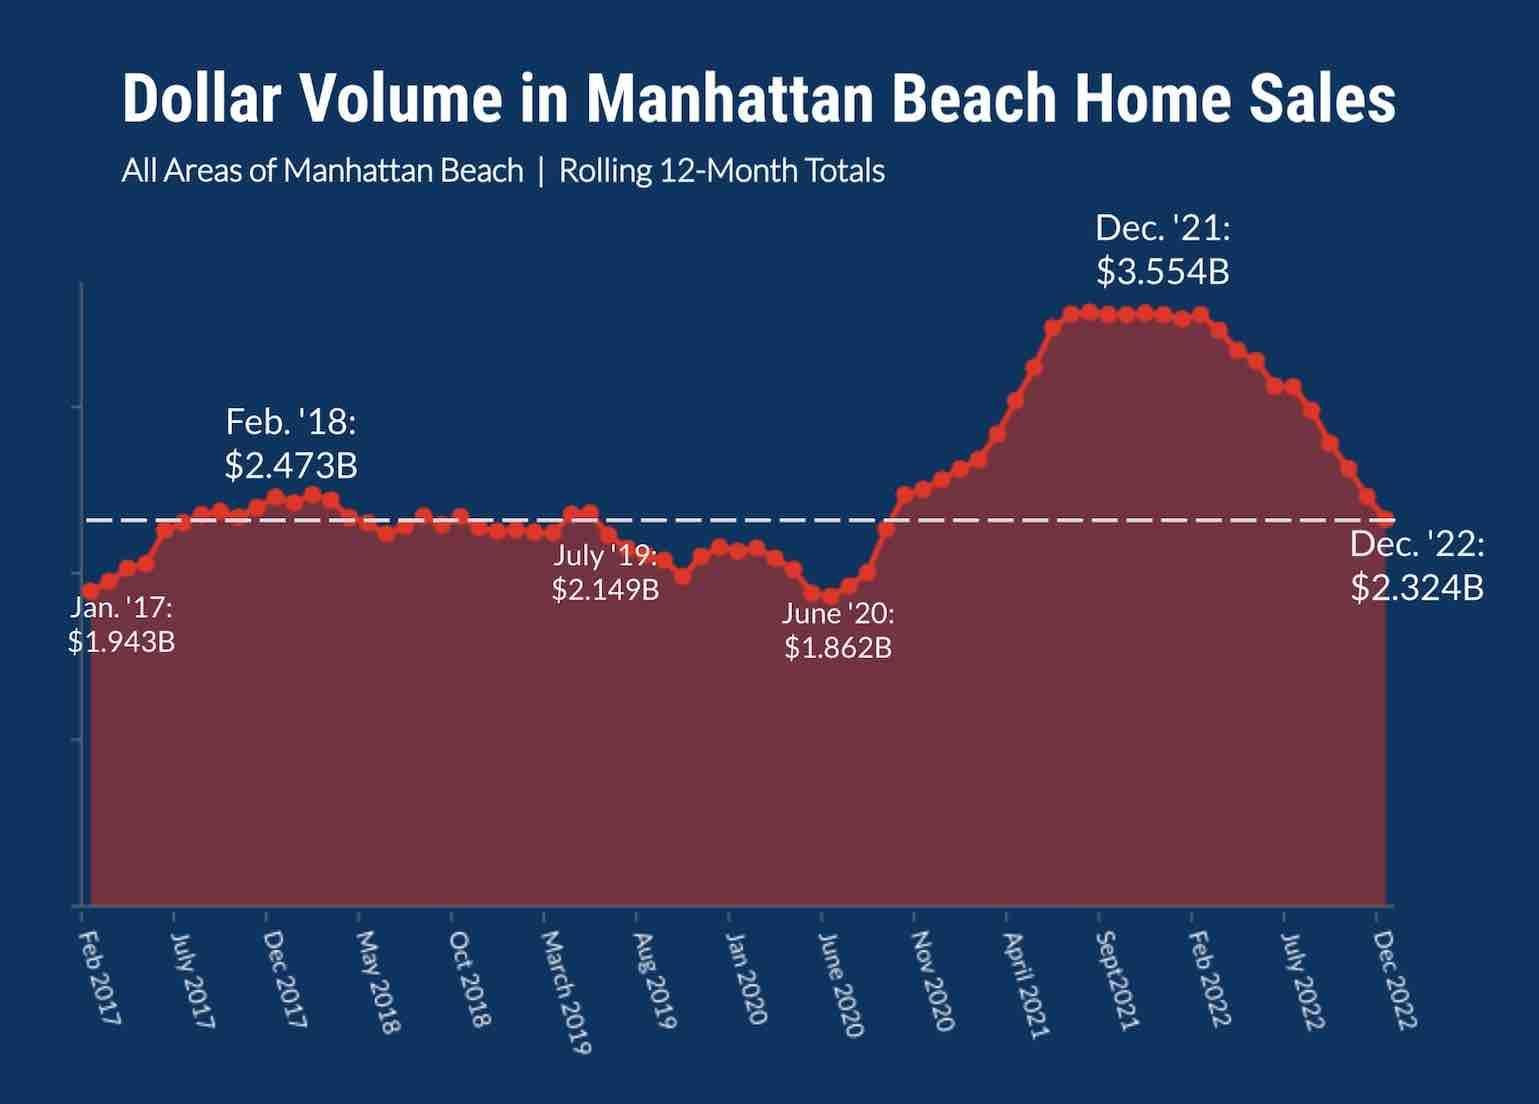
The last time Manhattan Beach saw sales volume over 12 months at this level was September/October 2020. Of course, the figure was leaping rapidly at the time.
As you can see in our chart above, sales volume was pretty consistently in this $2.3 billion range throughout the period of July 2017-July 2019. That sustained period saw substantially more sales, but at lower prices than 2022, which featured a median price consistently over $3 million.
One way to see the stark dropoff in sales volume is to look at how this past December performed compared to recent years.
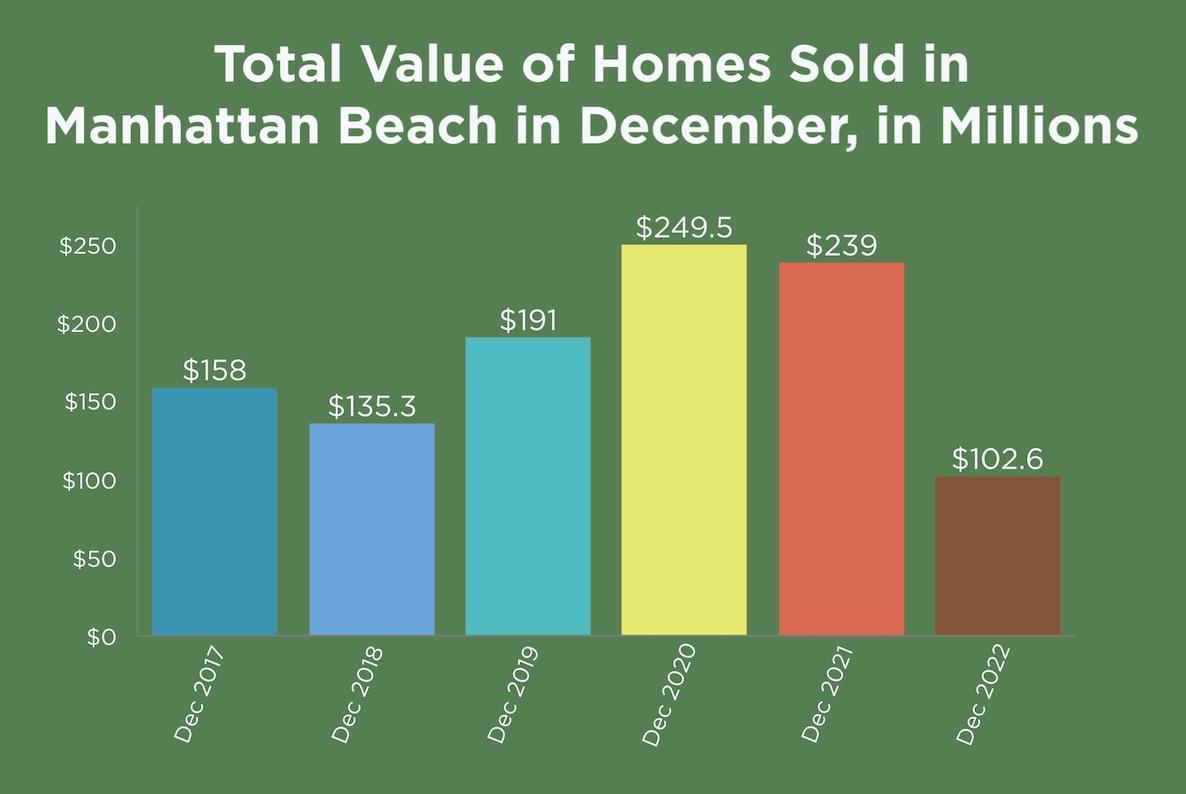
Yikes.
Here at MBC HQ, we remember late 2019 as a slow period that appeared to portend a flattening out - or reversal - in the market.
But December 2022 was much dimmer, seeing just 53% of the money transacted for local homes just three years prior. We also fell behind 2018, the lowest on this chart.
Now, you'll note that the byline here doesn't say "Debbie Downer."
Mainly, we like to tell it like it is, because market intelligence should be factual, not colored by whatever rooting interest one might have.
But also, every low that we point to now - over these several months as the pandemic-fueled market slows - also feels somehow reassuring. The trends simply can't continue downward at anything like the pace we have seen recently. (See also, "Data Show Drop in Sales, Suggest Bounceback," from November.)
If what you want is a more stable market, you might say, "let's get the declines over with and get back to business."
And hey, January's not off to a bad start.
By the 12th of the month, we had already seen $25.3 million in closed sales in town, with 625 33rd at $3.680M, 317 8th at $4.025M and 319 S. Dianthus at $9.800M leading the way.
Give this market a little time to take shape. Manhattan Beach is always resilient.
Please see our blog disclaimer.
Listings presented above are supplied via the MLS and are brokered by a variety of agents and firms, not Dave Fratello or Edge Real Estate Agency, unless so stated with the listing. Images and links to properties above lead to a full MLS display of information, including home details, lot size, all photos, and listing broker and agent information and contact information.
Based on information from California Regional Multiple Listing Service, Inc. as of April 16th, 2024 at 2:15am PDT. This information is for your personal, non-commercial use and may not be used for any purpose other than to identify prospective properties you may be interested in purchasing. Display of MLS data is usually deemed reliable but is NOT guaranteed accurate by the MLS. Buyers are responsible for verifying the accuracy of all information and should investigate the data themselves or retain appropriate professionals. Information from sources other than the Listing Agent may have been included in the MLS data. Unless otherwise specified in writing, Broker/Agent has not and will not verify any information obtained from other sources. The Broker/Agent providing the information contained herein may or may not have been the Listing and/or Selling Agent.


