 There must be a kind of glee some people feel from cherry-picking statistics. Find a few numbers out there that support your pre-ordained perspective, and push them out there to show you're right.
You see it a lot online these days with COVID-19 studies and stats, but you also might see it with real estate statistics. We do.
Since the first days of the safer-at-home regulations, we've been seeing real estate industry-friendly publications and marketers trying to tell everyone "all's well," even before data began rolling in.
For instance, there's a chart showing that home prices rose during most of the past several recessions. (Obviously not during the '08-'09 bust, which was a housing-led recession.)
Counterintuitive? Yes! Worth investigating. Should we have more recessions to goose up home prices?
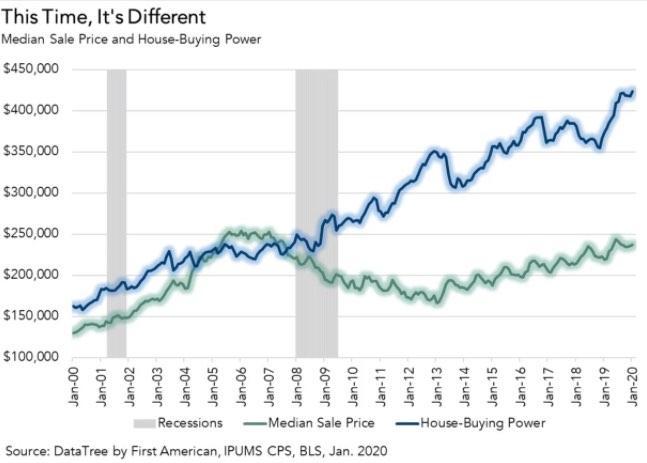 There's an article we saw (and bookmarked) in late March that proposed that the housing market might weather the COVID storm better than the last recession. It speaks of the market's prior "surging momentum" and says flatly that the "housing market is not overvalued." A graph is titled, "This Time, It's Different."
And there's the breathless realtor mailer we got at home in mid-April already talking about the "light at the end of the tunnel" and citing financial firms' projections for a quick return to business and a "rapid, V-type recovery" in the economy as a whole.
Just this morning, there's an article about how housing is going to the force to "bring back" the economy.
All of these chipper pronouncements, packed with data, came early and/or assumed the best.
The important question is: Why?
 They were all trying to bolster, or restore, confidence in the housing market.
That's the pre-ordained perspective the articles and data were supposed to support. That's always the agenda behind most real estate commentary and promotion: pushing confidence and alluding to an ever-improving environment. The marketers who shared that info early in these COVID times hoped maybe their audiences might like them a little more, because they made you feel good.
We can give you lots of reasons to be confident about Manhattan Beach real estate overall, about the market today, in 6 months or 2 years. But we're not going to snow you with statistics and expect that you'll tune out your own reasonable concerns.
Which brings us to the latest data presentation we've seen about Manhattan Beach, specifically. It's circulating on social media and you may see it in any number of places. This one was a bridge too far and we just had to respond. It might cause a bit of a rant.
The data are supposed to show you that April 2020 was an absolutely rockin' time in the Manhattan Beach real estate market. Mmm-hmm.
The graphic (which we are not reproducing here) included these year-over-year numbers for April in Manhattan Beach:
Median Sales Price
2019: $2,611,000
2020: $3,540,000 (+35.6%)
Avg. PPSF:
2019: $931
2020: $1,309 (+40.6%)
Avg. Days on Market:
2019: 63
2020: 41
So, wow! Prices are rocketing! Homes are selling faster!
But of course, that's not the whole story. And we can't even validate the stats these folks are advertising. (See our deep dive at the end of this post.)
There's one clue to what was really going on in April in a stat that is published alongside the others: "Units Sold" dropped from 44 in 2019 to 23 in 2020 (-47.7%).
Yes, that was a big dropoff in sales, and it created the next problem: An ultra-small sample size for all the rest of the data.
But then, a small sample size was already built in. They're using one-month statistics!
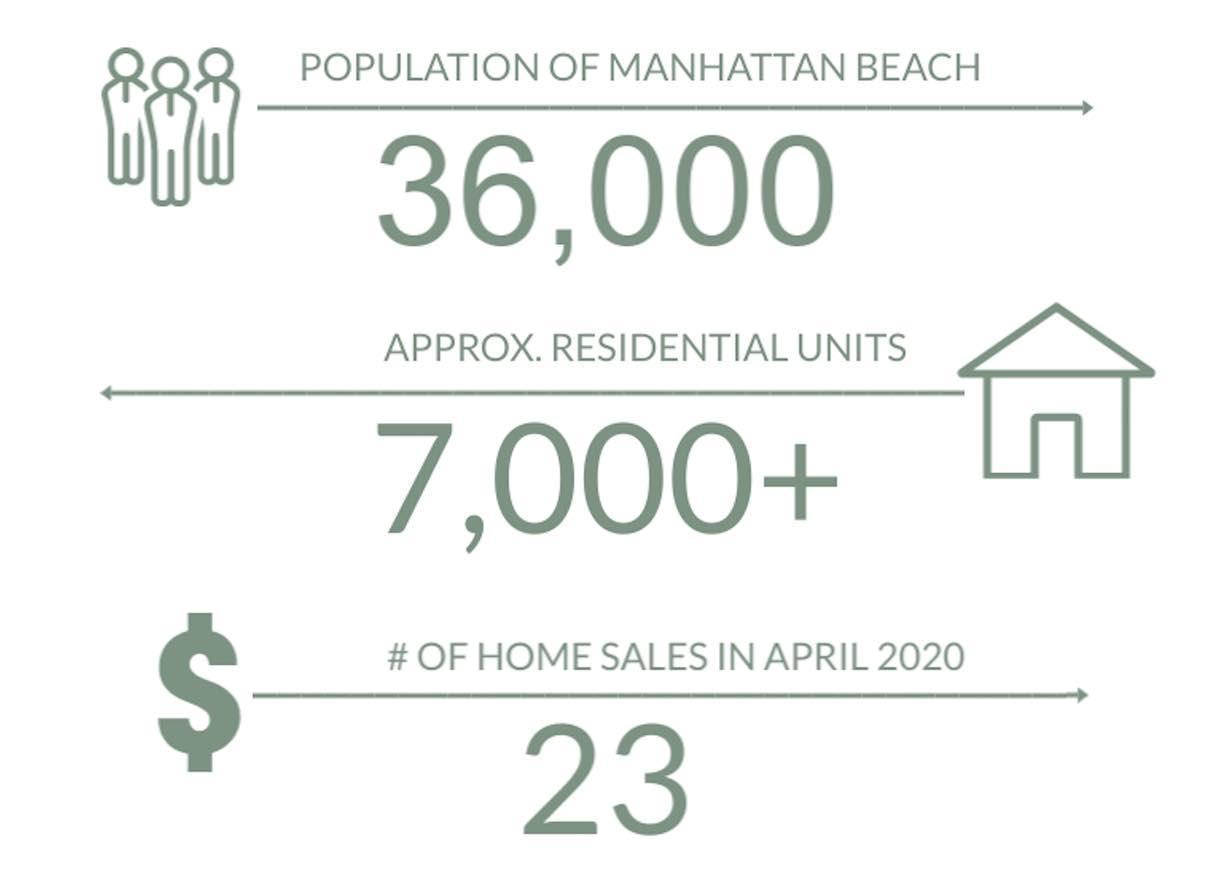 Please don't do that. You can't talk sensibly about a market with 7,000+ homes and 36,000 people based on one 30-day snapshot of market data. Certainly not based on 23 sales amid a pandemic-related shutdown. Does this even need to be said?
We believe in data here. MB Confidential has already published volumes of data about the true state of the market.
The data tell a story: We've seen a consistent drop in the pace of new escrows, but a surprising rise in the median price. (We use a one-year data sample, not a month.) We noted that April's 23 sales were the fewest in an April in 13 years, at least, including 2008-09. We've seen sellers holding back, until recently, instead of exposing their homes to a COVID-impacted market. That lowered inventory and pushed a bunch of listings to "hold" status. Now, we see inventory up, a bet that there are buyers poised to act. By one measure, inventory is higher now than any recent year for this point in the season.
Those are facts that underlie the market today, and which will help shape its course.
We don't think you should "panic" about how the market was impacted during a public health emergency. We also don't think you'd believe it if we said, "That was great! Let's have some more, please!"
Our view here is that grown-ups should be able to digest the full range of data, including the tougher news, and make judgments about how to act.
In our practice of real estate with clients, this is the kind of nuanced discussion of statistics, expectations and plans that we're having all the time. As Dave consults with clients, it's something like, "Here are the numbers, what do they mean for you?"
Bottom line: Be informed. Get as much info as you can. And watch out for screwy data with an agenda.
--------------------------------------------------
Nerdy Notes - About Those MB Stats
The graphic we saw from a local marketer used statistics for one month, April 2020, and compared to one other month, April 2019.
It's not rocket science, but their numbers simply are not right, as we'll show you.
They're using MLS data, which is clear because the graphic cites 44 sales in April 2019 and 23 in April 2020. Those are the precise totals for MLS-reported sales in April of each year.
After that, everything is wrong.
Remember, we really don't agree with using one-month data. But even those are incorrect:
 Median Sales Price
April 2019
Graphic: $2,611,000
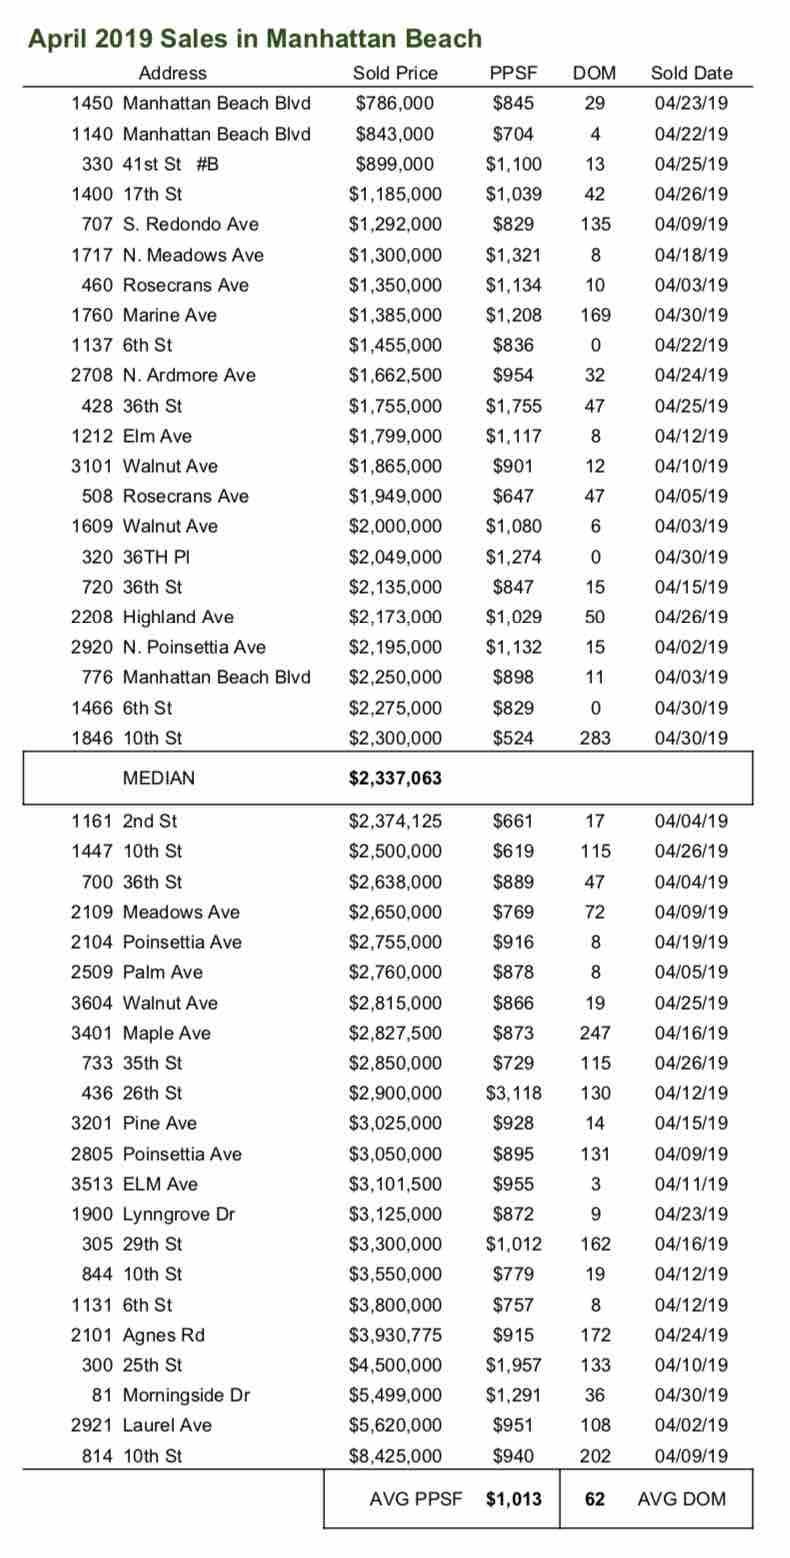
Actual: $2,337,063
April 2020
Graphic: $3,540,000
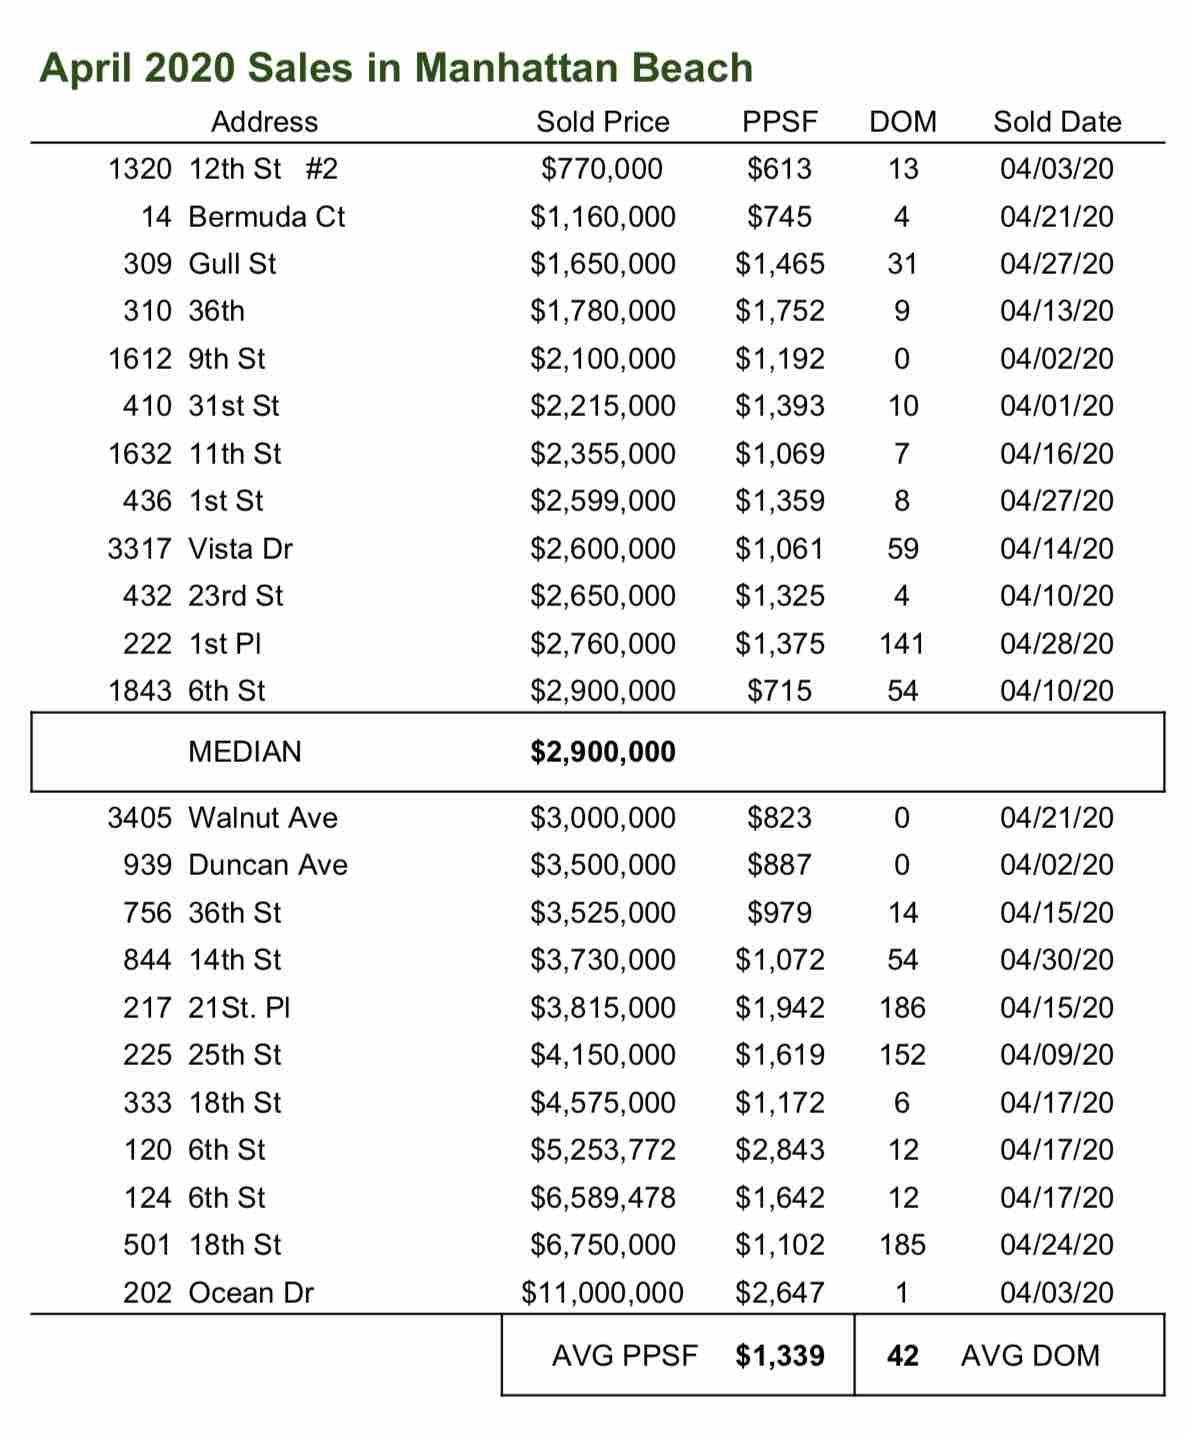
Actual: $2,900,000
Proclaimed year-over-year increase for April: +35.6%
Actual year-over-year increase for April: +24.1%
(see graphics for actual home sales and medians)
Avg. PPSF:
April 2019
Graphic: $931
Actual: $1,013
April 2020
Graphic: $1,309
Actual: $1,339
 Proclaimed year-over-year increase for April: +40.6%
Actual year-over-year increase for April: +31.6%
Avg. Days on Market:
April 2019
Graphic: 63
Actual: 62
April 2020
Graphic: 41
Actual: 42
Proclaimed year-over-year DOM drop for April: -22
Actual year-over-year DOM drop for April: -20
Quick discussion: If the marketer's graphic was based on MLS-reported sales data, as is evident, it's difficult to explain why it is all so wrong. There are no alternative methods of calculating a median price, average PPSF or average DOM. There is one method that yields one result for each data point. The correct data are all supplied above, including street addresses, sale prices, etc.
All of the data in the marketer's graphic were both wrong and skewed in the same direction, implying that April 2020 was (somehow!) substantially better than April 2019, except the number of sales.
Nerdy Note #2: We did not just crunch the numbers ourselves from raw MLS data, as supplied in this post. We verified the data with an MLS-based data cruncher called InfoSparks, which local MLS subscribers use for data runs like these.
Every single data point and calculation supplied by InfoSparks matched perfectly with the data we show and supply to you here. None matched the local marketer's data, except the # of "units sold," where we all agree based on MLS data.
Nerdy Note #3 (conclusion): There's a right way to do all of this. When we publish median price data, it's always based on a 12-month sample. We have published both average and median PPSF, but prefer median, not average, to limit the impact of ultra-high PPSFs on Strand properties and lot sales. Finally, average DOM are DOM on sold properties, so it's important to know this is the number of days typically associated with a successful sale, not all properties on the market.
Sorry, but we are not issuing prizes for reading to the end of the footnotes.


