Yesterday we looked at some of the most rock-bottom-priced Sand Section listings and sales by the measure of price per square foot (PPSF).
The inspiration for that post was a new price cut at 301 16th that called attention to the very low PPSF for the property – just over $500/PSF currently – which, we noted, is…
Yesterday we looked at some of the
most rock-bottom-priced Sand Section listings and sales by the measure of price per square foot (PPSF).
The inspiration for that post was a new price cut at
301 16th that called attention to the very low PPSF for the property – just over $500/PSF currently – which, we noted, is "unusual for the Sand Section."
So what's "usual" for the Sand Section?
We decided to answer that the best way we know how: With data.
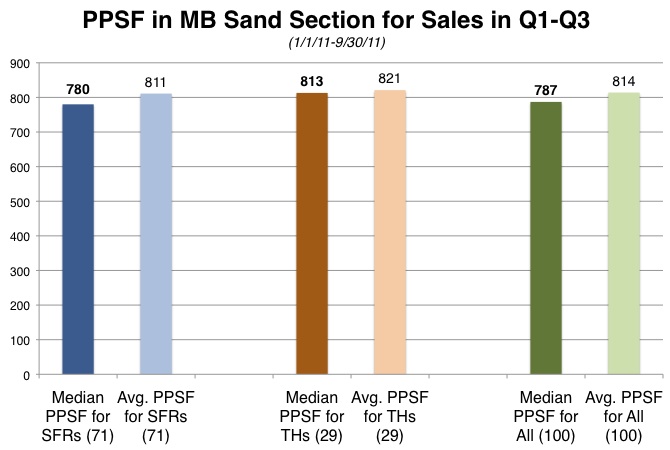
This new chart
(click to enlarge) gives you several answers, depending on what you're interested in.
The most solidly colored columns in the charts are the
median prices by the foot. (Half the prices in the sample are higher, half are lower.)
Medians are generally more reliable as indicators than averages. Average prices tend to be subject to greater fluctuation due to a couple of anomalous sales (high or low). You'll see in our chart here that, in every case, the average price is a nudge higher than the median.
The overall median PPSF for the Sand is
$787/PSF (green column on the right).
You could almost call that $800/PSF, which certainly underscores our point from yesterday – a PPSF near $500 is a major dip below the norm.
This figure of $787/PSF includes SFRs and townhomes, but not land sales.
This median is drawn from
100 MLS-reported sales in the Sand from Jan. 1, 2011, through Sept. 30, 2011, the first 3 quarters of this year.
Townhomes, more commonly beach-adjacent and therefore more valuable by the foot, had a higher median PPSF of
$813/PSF. (Rust-colored bar on the chart.) It's worth noting that there are relatively few sales to go by, even over 3 quarters, just
29 TH transactions in total.
SFRs as a group posted a slightly lower median PPSF of
$780/PSF (dark blue column), still within 1% of the overall Sand Section median. There were
71 sales in that mix.
Nerdy Note 1: In running these calculations, we specifically
excluded 7 high-PPSF sales which were either lot sales or principally land-value sales. If there's a small house on a valuable lot, the PPSF is all wobbly, largely irrelevant. (The top 3 of those were
205 20th,
319 23rd Place and
2908 The Strand; we also cut out
3120 Alma.)
Nerdy Note 2: Before we took that surgical step of removing land sales, we also needed to adjust the raw output of data in a couple of significant ways. A raw search turns up
1600 The Strand twice, so we removed the duplicate. There were also 2 improperly coded Tree Section sales in the Sand Section data at first, but we got those out, too.
We took out stuff that didn't belong, but we'll admit that we did not go the extra mile and
add off-market sales into this mix. In general, we knew that finding and evaluating every off-market sale just to evaluate PPSF would require more labor than justified by the value added.
We know, for instance, that we didn't add
1800 The Strand (5br/7ba, 5325 sq. ft.), the Sand's highest-dollar sale of the year at
$12.250m and one with a PPSF of $2,299/PSF. That one would have raised the SFR
average from $811/PSF to $832/PSF, but would barely have changed the
median for SFRs, from $780 to $781/PSF.
Now, what do you do with median or average PPSF for a whole sub-region of MB? Probably not too much.
With our diverse housing stock, the bulk data don't tell you much about how one specific property should be priced. But you can at least measure against these to say, for instance, "wow, did we get a deal!" Or not.
----------------------
Nerdy Note 3 – a soapbox moment: Putting in this kind of attention to the data output before running an analysis is what gives us confidence in MBC's figures, and, frankly, little confidence in the numbers generated by others, especially automated systems that cull data from who-knows-where without human intervention.
We recently saw a major local brokerage publish a "market update" for Q1-Q3 2011 that failed to remove duplicate sales and that compared 2010 to 2011 with a major apples-to-oranges mistake – including townhomes in one year's data, but not the other year's.
Sheez. Before you blame the interns who (presumably) ran the numbers, remember that nothing gets printed (or should get printed) without a responsible editorial eye passing over – but someone missed several incongruous conclusions drawn from the "market update" totals. (The bogus numbers suggested 2011 was blazingly better than 2010.) Yellow and red flags missed by the grown-ups.
Tsk-tsk.Lesson: If you don't know that your data source is exacting, don't consume the data.
Or: Don't sit down to eat at the restaurant if there's a "C" grade hanging in the window.
Please see our blog disclaimer.
Listings presented above are supplied via the MLS and are brokered by a variety of agents and firms, not Dave Fratello or Edge Real Estate Agency, unless so stated with the listing. Images and links to properties above lead to a full MLS display of information, including home details, lot size, all photos, and listing broker and agent information and contact information.