There's a rough dividing line between the "Spring" real estate market (kicking off with the Super Bowl) and "Summer" market, which more or less begins now.
If you meant to sell (or buy) in the Spring, too late. Now comes what is more typically a slower time of year for both listings and sales. Inventory tends to…
There's a rough dividing line between the "Spring" real estate market (kicking off with the Super Bowl) and "Summer" market, which more or less begins now.
If you meant to sell (or buy) in the Spring, too late. Now comes what is more typically a slower time of year for both listings and sales. Inventory tends to climb gently throughout the Summer.
We dare not predict, though – 2012 has packed some serious surprises, with low inventory, a flip to more of a sellers' market and more and more sales stacking up that could make you say "huh?!?"
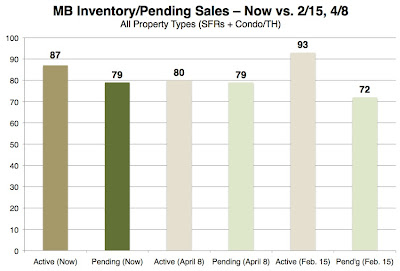
We did think this would be a good time for another check-in on inventory. Our newest chart (click to enlarge) looks at active and pending listings as of mid-February (the start of "Spring") this year and from another post in early April.
All these columns measure active and pending listings for all property types (SFRs, THs/condos) and for all of MB. The "now" data was compiled on the evening of May 28, Memorial Day.
In our mid-February post, "Quite a Ratio," we thought it notable that there were 1.3 active listings for every 1 listing in escrow. This seemed pretty tight, until April when the ratio was basically 1:1. We said then:
The usual course of the Spring "selling season" is that inventory begins to flow at the Super Bowl, and by April and May buyers have plenty of choices. This year, we are not yet seeing that pattern bear out. There are now fewer homes on offer in Manhattan Beach than in mid-February.
We also called April's data an "extreme... ebb" in inventory, wishing aloud for more options for all buyers, including our clients. (Some of whom, happily, have been successful in finding properties since that post.)
Today at least we can say there are slightly more choices than in April, with 87 active SFRs, condos and THs citywide. There are 79 properties in escrow, exactly like in April. We're still below mid-February in terms of active inventory, and the ratio of active to pending is still very tight, 1.1 to 1.
This means we've continued for a couple more months the year's trend of having too many buyers chasing too little inventory, contributing to the sellers' market vibe out there.
As you know, MBC has been covering MB west of Sepulveda for several years. So let's look back at inventory levels from times past.
Are you ready for some drastic contrasts?
First, we have to be sure to compare apples to apples. Previously we tracked only SFRs west of the highway.

So as of this Monday evening, there were 50 SFRs listed west of Sepulveda, including a double entry for 2016/2020 The Strand (the properties are being offered jointly as a double lot for $22.5m).
But 50 is nothing when we look back at recent years.
The last "hot" year was 2007 – and that year had lots of strange twists as the buyers' market was kicking in – and even then we saw 72 SFR options west of Sepulveda, nearly 50% more than you see today.
2008 had more than double the choices of today at 104 SFR listings, and – whoa – what's the big orange thing? That column shows inventory at an extreme as Summer dawned in 2009, 134 SFRs west of Sepulveda.
Close market watchers will recall that our local RE market begin to stabilize and turn around at the start of Q4 2009, so the beginning of Summer 2009 was nearing the tail end of the worst/slowest RE market we've seen here since (presumably) the last down cycle.
For one more contrast, look at that extreme year, 2009, again. Not only were there nearly 3 times more SFR listings then, look at the Hill Section specifically. At that moment in time 3 years ago, there were 33 active SFR options in the Hills. Now: 6. Not 26 or 16, just six (6).
So yes, things are unusually tight today, again, wherever you're looking. But there's ever that hope that beyond the horizon, more and better options will emerge, and greater balance as well.
Please see our blog disclaimer.
Listings presented above are supplied via the MLS and are brokered by a variety of agents and firms, not Dave Fratello or Edge Real Estate Agency, unless so stated with the listing. Images and links to properties above lead to a full MLS display of information, including home details, lot size, all photos, and listing broker and agent information and contact information.
Based on information from California Regional Multiple Listing Service, Inc. as of May 13th, 2024 at 9:51pm PDT. This information is for your personal, non-commercial use and may not be used for any purpose other than to identify prospective properties you may be interested in purchasing. Display of MLS data is usually deemed reliable but is NOT guaranteed accurate by the MLS. Buyers are responsible for verifying the accuracy of all information and should investigate the data themselves or retain appropriate professionals. Information from sources other than the Listing Agent may have been included in the MLS data. Unless otherwise specified in writing, Broker/Agent has not and will not verify any information obtained from other sources. The Broker/Agent providing the information contained herein may or may not have been the Listing and/or Selling Agent.


