Skip to main content
Produced by Dave Fratello, Edge Real Estate Agency
Contact Dave:
(310) 243-6299
Blog
Searches
Open Houses
Manhattan Beach
Hermosa Beach
Redondo Beach
Manhattan Beach Homes for Sale
All Manhattan Beach
Sand Section
Tree Section
Hill Section
East Manhattan
South Bay Homes for Sale
Hermosa Beach
Redondo Beach
Palos Verdes Area
Torrance
All South Bay Areas
Custom Manhattan Beach Searches
Recent Sales
New Construction
Walkstreet Homes
Homes Under $3M
Luxury Homes Over $4M
West of Sepulveda
MB Rentals
Manhattan Beach Neighborhoods
Manhattan Beach Strand
Manhattan Village
El Porto
Downtown Area
More Neighborhoods
Advanced/Map Search
Popular South Bay Areas
North Redondo
South Redondo
Hollywood Riviera
Palos Verdes Estates
Hermosa Sand Section
NOW
Manhattan Beach Dashboard
Full MB Dashboard
Newest Listings
Newest Deals
Newest Sales
Newest Cuts
The Ticker
Other City Dashboards
Hermosa Beach
Redondo Beach
Palos Verdes
Torrance
DATA
Manhattan Beach Median Home Prices
Latest Inventory Report
Latest Pending/Sold Report
Recently Sold Homes by Area
Inventory Trends
Price Trends
Tools
Manhattan Beach Property Taxes
Manhattan Beach schools
City of MB Property Info
About
About Dave
About Manhattan Beach
Edge Real Estate
Client Reviews
MB Confidential
Contact Dave
Sign In
Found
318
blog entries about sales data.
First Over $4M on a 5K Lot?
By
Dave Fratello
| April 16, 2024
Price Record for Village Plan 1 Destroyed
By
Dave Fratello
| April 3, 2024
Is That a Q1 Bounce? - Manhattan Beach Market Update...
By
Dave Fratello
| April 2, 2024
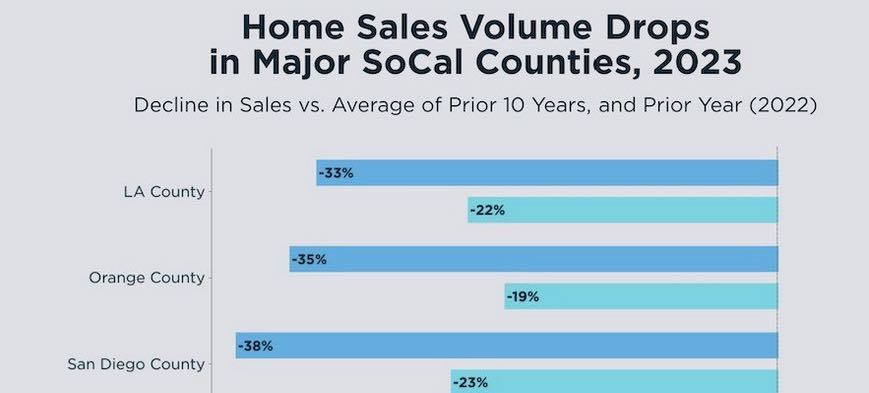
How Far Home Sales Fell in SoCal in 2023
By
Dave Fratello
| February 19, 2024
Recent Median Price Growth, and Drop, for Manhattan ...
By
Dave Fratello
| February 7, 2024
High Sales of 2023: Hill Section
By
Dave Fratello
| February 5, 2024
High Sales of 2023: Tree Section
By
Dave Fratello
| January 22, 2024
High Sales of 2023: Sand Section
By
Dave Fratello
| January 10, 2024
Numbers Tell the Tale of '23 - Manhattan Beach Marke...
By
Dave Fratello
| January 3, 2024
1
2
3
4
36
Next