The pace of home sales in 2023 slowed dramatically all over Southern California.
In many – but not all – SoCal areas, the number of homes sold last year was below the market-crash years of 2008 and 2009.
There wasn't a market crash, however, but mainly a yearlong lack of inventory. Fewer homes for sale necessarily means fewer homes sold.
We'll get to Manhattan Beach, but let's look at all of SoCal first. Here are results from five of the major counties down here in our part of the state.
SoCal Counties Sales Totals
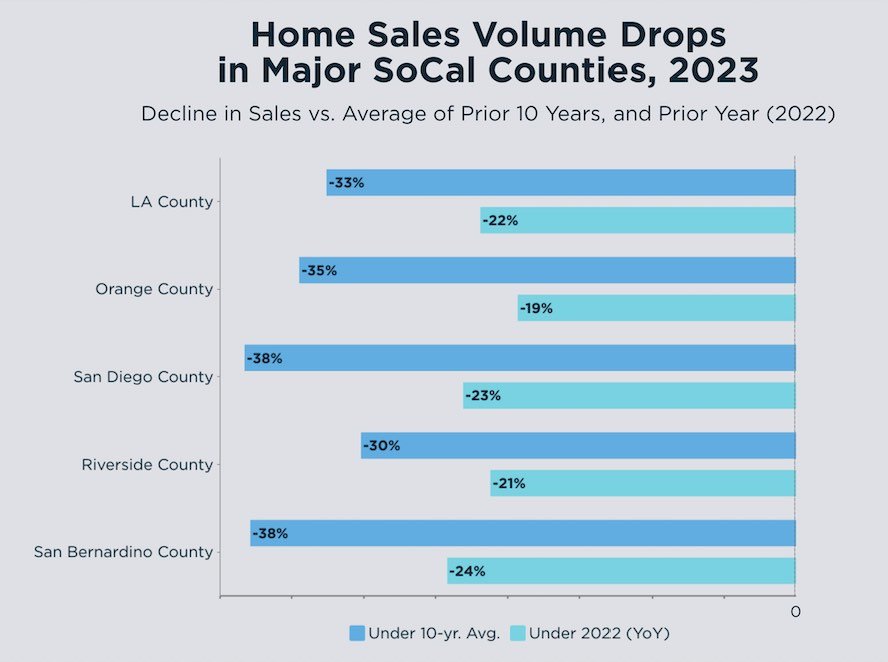
We are looking at longer-term and short-term data at the same time.
The larger, darker blue bars in each case show how far home sales totals were below the average of the prior 10 years (2013-2022).
The lighter blue bars show the year-over-year decline, less drastic in each case than the drop from the 10-year average.
The year-over-year deceleration was lesser in degree in reflection of the fact that 2022's sales in each county already were below average. So when LA County, for instance, dropped 22% year-over-year, the total was dropping from an already-subpar year prior.
It's slightly reassuring to see that LA County's 33% dip below the 10-year average was 2nd-best on the list, with OC just a little worse off at 35% below that long-term average, and both San Diego and San Bernardino at 38% under.
Overall, the trends are very similar between counties for both the short- and long-term data.
As we look at a few more charts, you're going to see very similar trends almost every time.
Let's start by taking a look at the South Bay as a whole.
South Bay Sales Totals
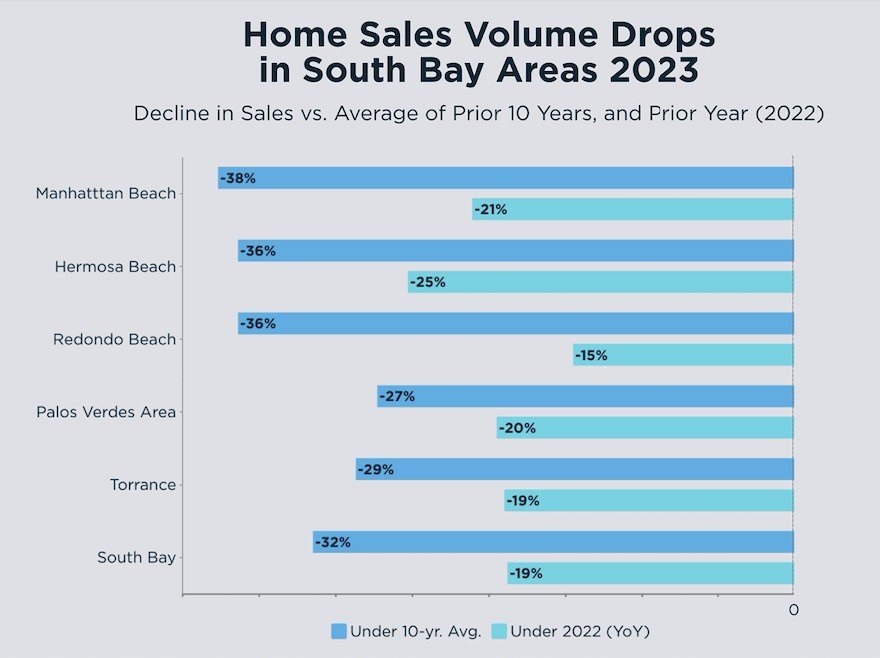
Yikes. Manhattan Beach has the biggest dark-blue bar. In this case, that's not good.
Our sales totals here were 38% below the 10-year average, with Hermosa and Redondo close behind at 36%.
That means MB was 5% worse off than LA County as a whole, but our market's data obviously was not without precedent. We see the same 38% drop in two of the big SoCal counties in the first chart.
The South Bay as a whole – in this case, the three beach cities, Torrance plus the whole of the Palos Verdes area – was down 32% for the period, and 19% year-over-year. Manhattan Beach was down 21% year-over-year, closer to that South Bay average.
Let's look at some roughly comparable LA-area cities and regions.
L.A. Cities/Areas Sales Totals
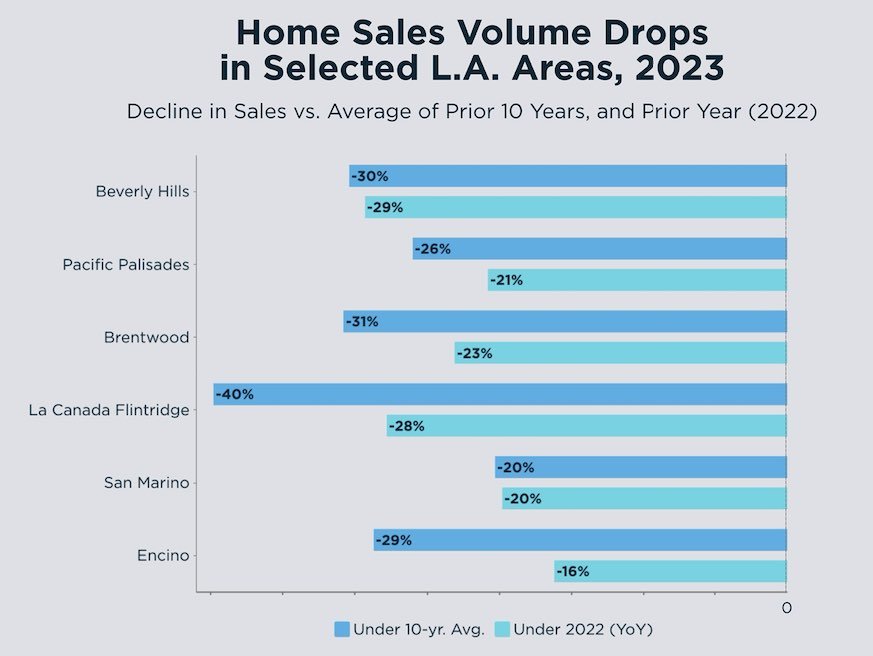
The patterns here among Beverly Hills, Pacific Palisades, Brentwood, La Canada Flintridge, San Marino and Encino are broadly similar to those in our first two charts, with some interesting exceptions.
La Canada shows the deepest drop from the 10-year average that we've encountered, at -40%.
While our beach cities were all down 36-38% from the long-term average, most of these other markets fell less steeply, by 5-10%. That is to say, they had relatively closer-to-typical sales volumes. It's notable that Brentwood was subject to the city of L.A.'s new tax on sales of homes priced over $5M, but did not fall off average as much as Manhattan Beach.
We also noted that both Beverly Hills and San Marino were very close in their year-over-year versus long-term declines. Indeed, San Marino's figures are nearly identical for these two periods. (The chart label is rounded to 20% for each period, but it was -20.3% against the 10-year average and -19.8% year-over-year.)
What those data from 90210 and San Marino tell you is that sales totals in those areas in 2022 had already slipped down closer to the 10-year average, after a hot 2020-21. Meantime, other markets still had some excess or above-average sales in 2022, carrying over the pandemic rally at least part way into the year.
For our last chart, Orange County beaches.
Orange County Beach Cities Sales Totals
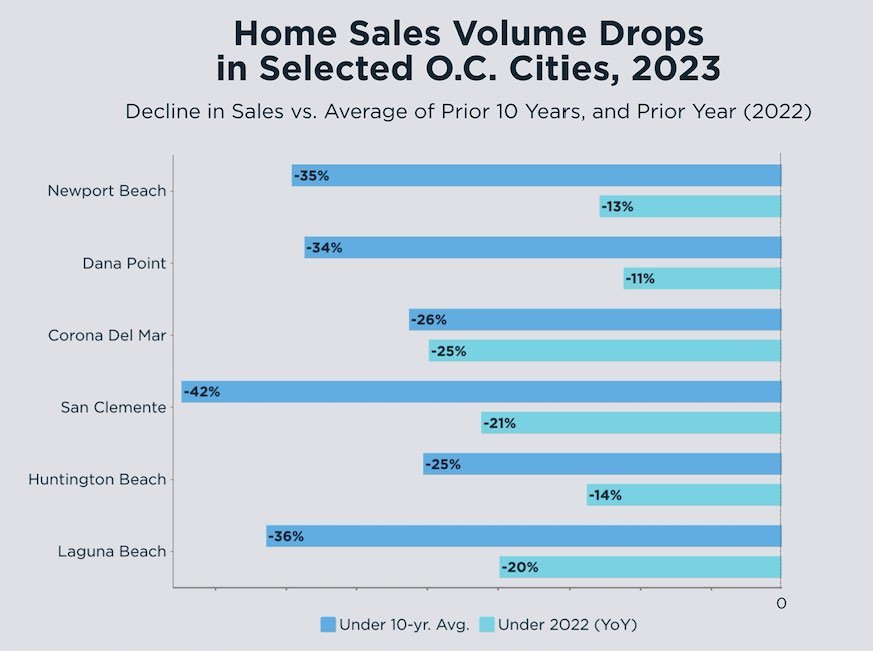
Well, isn't it nice to have brethren among coastal cities to the south, going through the same stuff?
Laguna, Dana Point and Newport Beach all suffered comparable drops in sales totals to each of the South Bay beach cities, falling between 34-36% against the long-term average, although not as steeply year-over-year in every case.
Poor ol' San Clemente fell 42% against the 10-year average, and we're not talking about a little market here. In super-quiet 2023, Manhattan Beach had 254 sales. San Clemente had 549. This sales total drop is not some statistical quirk.
Newport, Dana and Huntington did have some of the least-steep year-over-year drops. What that tells you is that their markets had already cooled off more in 2022 than some other markets, with sales totals nearing the longer-term average by then.
Things Were Tough All Over
We've been gathering these data partly to put Manhattan Beach's experience of 2023 in context.
The market really did slow down just about every darn place, and by similar degrees. Median price changes, however, were all over the place, holding steady or rising slightly in most of the markets referenced above – but not Manhattan Beach. (See "Recent Median Price Growth, and Drop, for Manhattan Beach.")
Not a single market we studied had more sales in 2023 than in 2022, and most were around 30% lower than their 10-year averages.
It continues to be astonishing that there were no economic calamities driving the down year in housing in 2023. In fact, arguably, the opposite was going on in the economy – a strengthening recovery, with low unemployment, wage growth and moderating inflation.
The "new normal" is modest mortgage interest rates that "feel" high because of how low pandemic-era monetary policy brought rates. These fluctuations in local real estate markets now are part of working out the hangover from that particular low-interest-rate party.
If we re-do these charts next year, we'll bet almost all of them will look very different, with some numbers to the right side of zero. (Hey, does Vegas take bets on stuff like that?)
Please see our blog disclaimer.
Listings presented above are supplied via the MLS and are brokered by a variety of agents and firms, not Dave Fratello or Edge Real Estate Agency, unless so stated with the listing. Images and links to properties above lead to a full MLS display of information, including home details, lot size, all photos, and listing broker and agent information and contact information.

