There was really only one thing that was guaranteed to happen in this year's real estate market in Manhattan Beach:
It would be busier than last year.
And so far, it is. There's quite a bounce toward normalcy already evident in stats for the first quarter.
For instance, this is a slow time of year, but the first quarter saw 50% more sales than Q1 2023:
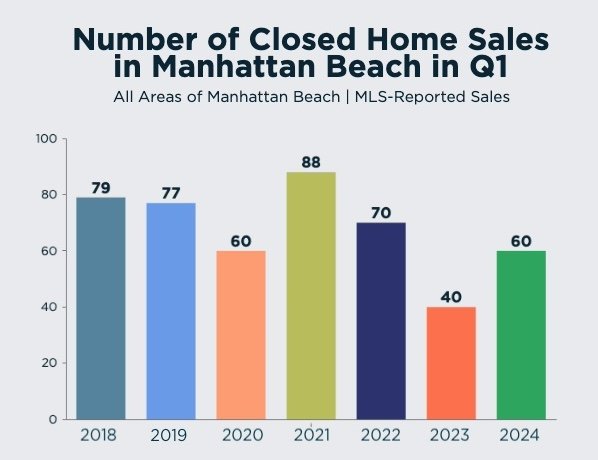
With 60 closed sales in the first 3 months, we're not setting any records, but we're not in the doldrums, either.
This year's total is obviously short of hotter years like 2021 and '22, and "normal" years like 2018-19. But it's even with 2020, and trending up over last year's dismal 40 closings.
Remember, the full year 2023 saw only 253 closed sales in Manhattan Beach, whereas something near 400 is more typical. (See our post, "Numbers Tell the Tale of '23.")
We know that the bulk of sales in town will close in Q2 and Q3, but it's nice to get off to a good start.
Want a prediction? We think this initial pace could bring MB to 360 transactions or so by year's end. (No bets, please. It's a feeling.)
Let's look at the value of homes sold during Q1:
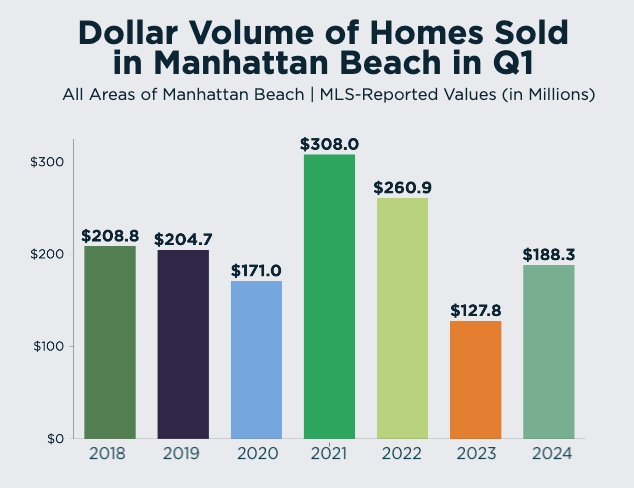
With $188.3M in closed sales, this year has started out better than 2023 and 2020, and really doesn't lag those "normal" years of 2018-19 by much.
It does seem like a lot of lower-priced homes have been moving, but there's a good mix in this data:
- 17 sales priced under $2M
- 18 sales priced $2M-$3M
- 8 priced $3M-$4M
- 9 priced $4M-$5M
- 5 priced $5M-$6M
- 2 priced $6-7M, and
- 2 priced $7M+
That's 35 under $3M and 25 over $3M, roughly where our local median value has been recently.
While our market is definitely still short inventory, and the Spring season has seemed slow to get rolling, we're starting out OK.
Here's the rest of our local real estate market update report for the period ending 3/31/24:
> 62 active listings as of 3/31/24 (-7 from 3/15/24)
> 45 SFRs (-3)
> 17 THs (-4)
See the Inventory list as of 3/31/24 here, or see the MB Dashboard for up-to-the-minute data.
Active listings by region of Manhattan Beach in this report:
> Tree Section: 5 actives (-3)
> Sand Section: 37 actives (+1)
> Hill Section: 5 actives (-2)
> East MB: 15 actives (-3)
We're also providing a report on closed sales by region of MB.
Sales data, including PPSF for all properties, are organized by sub-region of Manhattan Beach.
Here's a link to the spreadsheet: "MB Pending/Sold as of 3/31/24".
Please see our blog disclaimer.
Listings presented above are supplied via the MLS and are brokered by a variety of agents and firms, not Dave Fratello or Edge Real Estate Agency, unless so stated with the listing. Images and links to properties above lead to a full MLS display of information, including home details, lot size, all photos, and listing broker and agent information and contact information.

