Welcome back and happy new year to you.
With 2011 behind us, we'll begin a series of looks back at the data for local real estate.
For most of last year, starting with a lookback at Q4 2010, we observed and reported data showing that the MB real estate market was fairly stable, but prices were creeping slightly…
Welcome back and happy new year to you.
With 2011 behind us, we'll begin a series of looks back at the data for local real estate.
For most of last year, starting with a lookback at Q4 2010, we observed and reported data showing that the MB real estate market was fairly stable, but prices were creeping slightly lower overall. At the same time, paradoxically, the very high end was shooting higher.
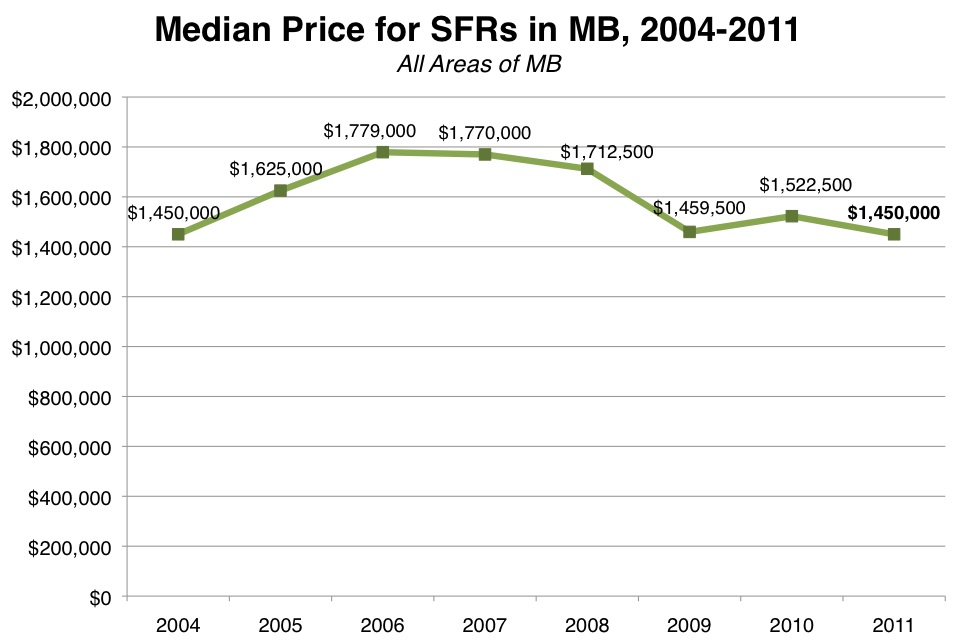
As we now look back at the whole of 2011, these trends were consistent across the year. The number of sales was up a tad from 2010, but the median price for SFRs in MB overall was
down 5%.Interesting, is it not, that the earliest reports were consistent with the full year's data?
Most remarkably, the 2011 median price for SFRs in all of MB equaled the median for 2004. In both years, the median price was
$1.450m. (That's in non-adjusted dollars, of course.)
That means last year, pricewise, was a slight tick down from the year we all recognize as the recent "bottom" for local real estate: 2009.
The 2011 median also means MB prices are
down 18% from the peak, comparing full calendar years.
In a real estate environment in which drops of 30% or more are not unusual all over the nation, an 18% drop still reflects solid staying power. However, it's not as delightful as last year's report that MB was down 14% peak-to-trough.
Now, 2004 prices in 2011?
Here at MBC, we began talking about how we were "living in 2004 prices" back in 2009, based partly on medians and more particularly on same-house sales (bought in 2004 and resold in 2008-2009). That hasn't been as frequent an observation here recently, but the data tell us that it may be time to revive that.
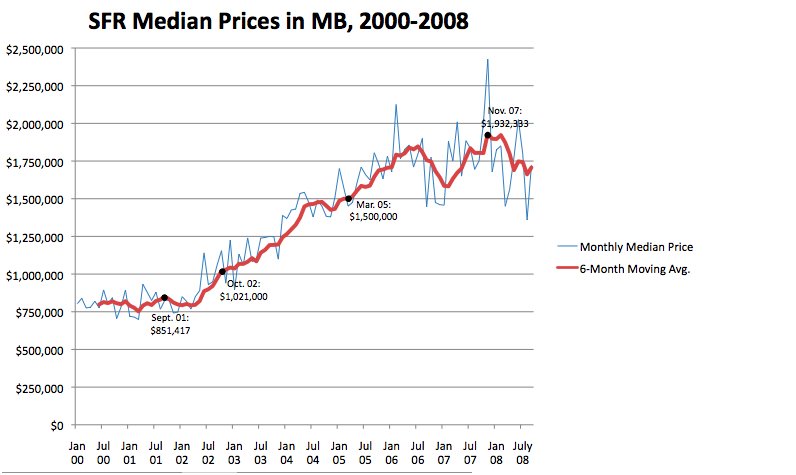
For some context on median prices in MB during the bubble years, we looked back at a Nov. 2008 post, "
How're Median Prices Doing?" This chart is from that original
(click to enlarge).As with this post, the data source is the MLS, though in 2008 we were looking at monthly median prices and using a 6-month moving average to chart the inflation of median prices from 2000-2008.
Notable there is the rapid inflation in prices during the whole year of 2004. It's a big step up from Jan. 2004 to Jan. 2005.
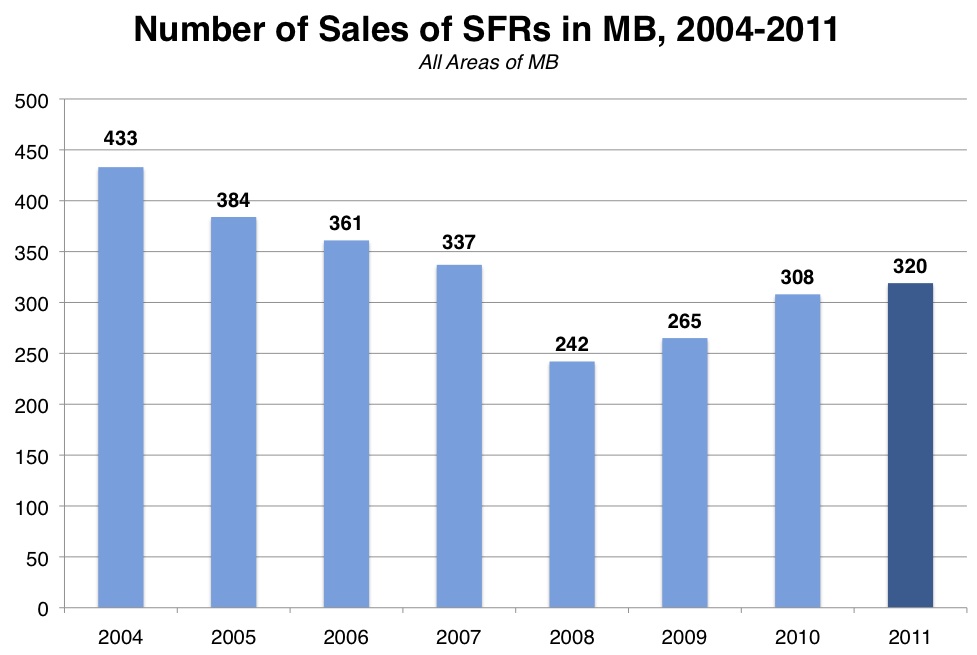
Coming back to 2011, the total number of sales last year in all of MB was
320, or 12 more than 2010.
You can call that more or less flat, but it's a decent pickup from both 2008 and 2009. As our chart here shows, you have to reach back to the final bubble years of 2006-07 to find more sales in a calendar year.
It would seem Q4 was a bit slower than last year in terms of closed sales, because at our
midyear and
Q3 check-ins, the 2011 sales pace was at 16 and 18 higher than last year.
One of the first startling things to see in the raw data is that
80 sales were at or under $1m.
That's a notable 33% rise in $1m-and-under sales from just 2010, when the figure was 61. It's also double the number seen in 2008, and 11 higher than the bottomed-out year of 2009.
In fact, the last time we saw 80 sales at or below $1m was in 2004
(there's that year again!), a time when total sales volume citywide was 36% higher.
Just one year before, however, in 2003, the $1m-and-under category was comparatively gigantic at 181 sales (on total volume of 477 sales). That's another way of seeing how the rapid inflation of prices during 2004 affected overall sales data.
We'll continue examining the data for 2011 in a series of upcoming posts, starting with a look at west-of-Sepulveda data separate from the rest of MB.
Please see our blog disclaimer.
Listings presented above are supplied via the MLS and are brokered by a variety of agents and firms, not Dave Fratello or Edge Real Estate Agency, unless so stated with the listing. Images and links to properties above lead to a full MLS display of information, including home details, lot size, all photos, and listing broker and agent information and contact information.