2010 was clearly a rebound year for local RE, with more sales and a slightly higher median price in MB than 2009.
We discussed that first in the
Daily Breeze, in last weekend's South Bay Confidential column.
(Click to enlarge the graphic here, which was crafted by their artists, not MBC.) In short, the sales pace…
2010 was clearly a rebound year for local RE, with more sales and a slightly higher median price in MB than 2009.
We discussed that first in the
Daily Breeze, in last weekend's
South Bay Confidential column.
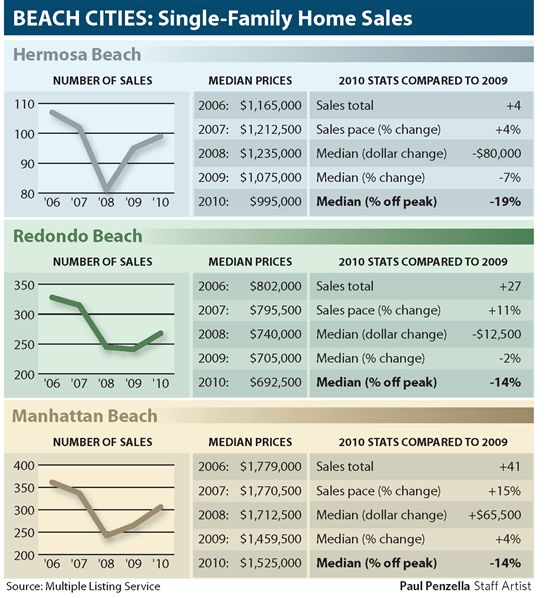
(Click to enlarge the graphic here, which was crafted by their artists, not MBC.) In short, the sales pace citywide in MB was up 15% for the year and the median price, at
$1.525m, was up 4% over 2009. MB was the only one of the 3 beach cities that saw a rise in median price.
By these numbers, MB is down 14% from the full-year median-price peak in 2006. Individual home prices, of course, may be down more or less.
We've also been asked about more recent trends. For instance, how did 2010 close out?
If we isolate and compare 4th quarters (Oct.-Dec.) across the last 11 years, we see that Q4 2010 was a mixed bag.
(Click graphic to enlarge.)Citywide, SFR sales were down slightly from 2009, at
70 last year versus 77 in 2009. But west of Sepulveda, the picture is reversed, with
50 sales in 2010 against 46 in 2009.
Both 2009 and 2010 substantially outstripped the 4th-quarter sales figures for 2006-2008.
Q4 2010's total number of sales, citywide and west of Sepulveda, comes closest to 2005 – a boom year. No recent year saw greater sales in both categories; we have to go back to 2004 to find a greater sales pace. As our chart shows, all of the early-decade 4th quarters were busier, with a peak in Q4 2001 and Q4 2000 just a couple of sales behind that peak.
But here's some surprising news – with all this yearlong data and sales pace data pointing to a nice upward bump, median prices for Q4 2010 were actually down, compared with other 4th quarters.
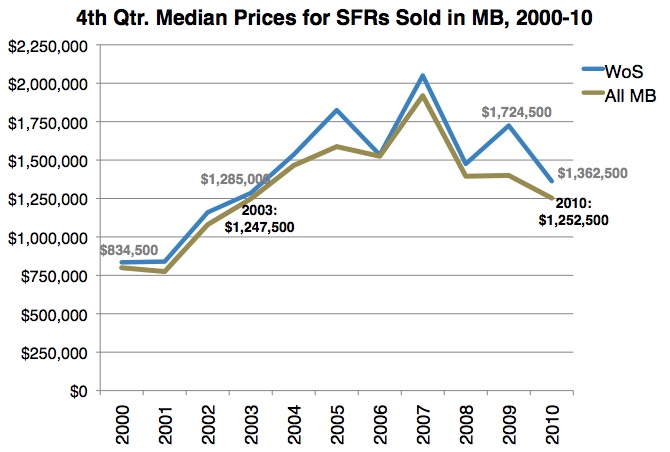
(Click graphic to enlarge.)Indeed, the citywide median price wound up 2010 barely a nudge above 2003 – rounding out last year at
$1.252m, compared with $1.247m in Q4 2003.
Back then, citywide prices were rapidly inflating, with a 4th-quarter median-price peak being reached in 2007.
West of Sepulveda, the 2009-2010 comparison appears grim at first. The 4th quarter median cascaded 21% –
yikes – from $1,724,500 in '09 to
$1,362,500 this past year.
One glance at our chart here helps balance that out. Clearly these quarterly medians are volatile, especially by the beach. The west-of-Sepulveda median is always greater than the citywide median, owing to values east of the highway being somewhat lower. And though west MB's median has often tracked the citywide trend, in 2005 and 2009 there were crazy spikes.
2009's Q4 median shot up 17% over the previous year, so a comedown of 21% looks somewhat less startling if we concede that '09 was a bit anomalous. There were simply a bunch of pricier sales in the 4th quarter of 2009, for whatever reason.
Ignore 2009 a moment, and 2010's 4th quarter median was down $112,500, or almost 8%, from 2008's median ($1.475m). Somewhat less alarming.
That said, 2010's final quarter west of Sepluveda was – just like the citywide figure – the lowest since 2003, when the Q4 median was at $1.285m. That puts the median up just 6% over that year, while 2010 was more than 11% shy of the median for the final quarter of 2004.
Please see our blog disclaimer.
Listings presented above are supplied via the MLS and are brokered by a variety of agents and firms, not Dave Fratello or Edge Real Estate Agency, unless so stated with the listing. Images and links to properties above lead to a full MLS display of information, including home details, lot size, all photos, and listing broker and agent information and contact information.