Fewer sales, lower prices... if you've been following our last couple of stories on sales volume from 2007-2009, you may have already drawn an obvious conclusion: there's a lot less money in the local RE market these days. (See "Pace Slower, Prices Lower" and "Sales Mix Changes, 2007-09.")
How much less?
Let's start…
Fewer sales, lower prices... if you've been following our last couple of stories on sales volume from 2007-2009, you may have already drawn an obvious conclusion:
there's a lot less money in the local RE market these days. (See "
Pace Slower, Prices Lower" and "
Sales Mix Changes, 2007-09.")
How much less?
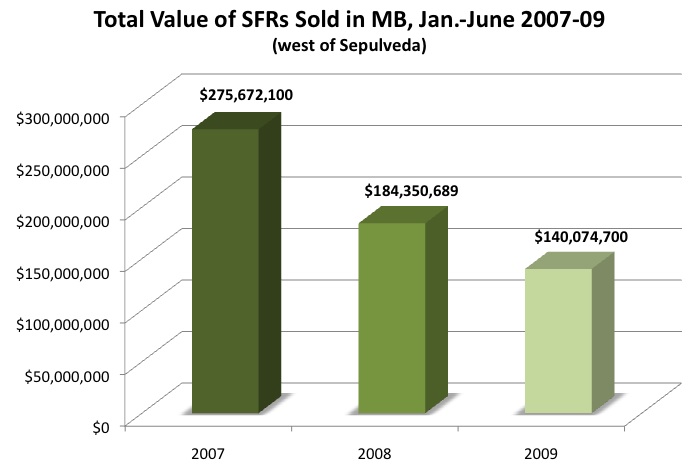
Let's start by looking at the total dollar volume for SFR sales west of Sepulveda.

On the strength of
129 SFR sales in the first half of 2007, with a higher median value than today's, the total value of all SFRs sold west of Hwy. 1 was more than
$275 million.
(Click any graph in this story to enlarge.) This year, with 41% fewer sales and a median price 22.4% lower, dollar volume dropped to
$140 million – a total drop of 49%.
(Figures presented here are actual totals of all sales posted on the MLS in the periods covered.)
Sure, 2008 was a big dropoff: 33% from 2007. But 2009's dollar volume took a further dive of 24% off last year's figure.
Of course, all of these dollar figures remain quite substantial. It's worth a moment's reflection to note that, even in a real estate market that is slower than almost anyone can recall, $140 million was spent on homes in just the small pocket of land in MB west of Sepulveda. In just half a year. And that doesn't even count townhomes.
Before you ask – as Mrs. MBC already did – we
don't have comparable dollar volume figures from years prior to 2007. A person would need fairly complete access to the MLS database to compile that information, and your blog author doesn't have that. (If someone wants to help gather comparable data, we'll chart it and publish it. We're also hopeful that we can update some DataQuick figures we have through early 2009.)
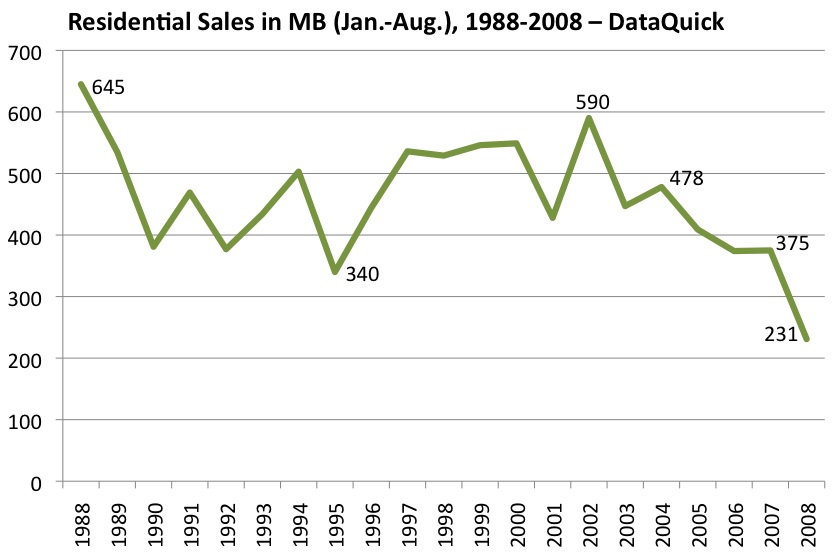
One question we'd be looking to answer is whether 2007, or perhaps some year just prior, was the peak year for dollar volume in the first half.

You might guess that the peak year would be one between 2005-2007. However, as this chart shows, the recent peak for sales volume – by a lot – was 2002. (Chart is from late 2008's "
Turns Out '08 Got Worse" and uses DataQuick figures, not the more limited MLS data.) So even if prices were lower then, perhaps volume in 2002 drove up the total dollars transacted. We'll see.
Another reference worth a glance is at the
South Bay Beaches Bubble site, which compiles month-by-month dollar volume for all real estate transacted by ZIP code from
Melissadata.com. The link to
MB data is here (current through March 2009), and the link to the tool for pulling up
other ZIP codes is here.
If there's less money in the local RE market, that also means there's less money to support the industry that gets some people out of homes and puts others into them.
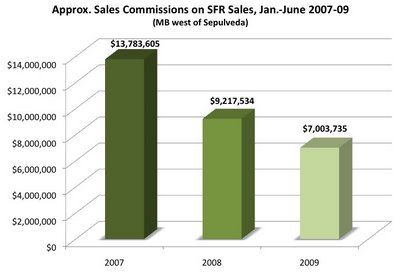
The business of real estate sales is based on sales commissions. In lots of markets, the standard commission is 6%, but plenty of MB sales are conducted at a lower rate.
To estimate the impact on the RE sales community from the lower dollar volume in sales, we used an across-the-board estimate of 5% commissions for sales in each of the 3 years from 2007-2009.
That nice little boomlet in Spring 2007 helped deliver about
$13.8 million to local brokerages in the first half of that year.
This year:
$7 million.
That's a lot less money to go around.
As fate would have it, some of the costs of doing business are up. SFR inventory west of Sepulveda is almost double the
83 homes for sale at the end of June 2007. (For a graph of inventory in 2007-08, see "
Inventory Higher This Year" from Dec. 2008.) That means more marketing costs for listings that just sit.
And sit they will – average days on market for listings has been stuck above 100 for some time. In
a mid-June post, Kaye Thomas noted that, even by MLS data – which are subject to manipulation by bogus re-lists – average DOM was at
103-
115 for the 3 submarkets west of Sepulveda.
Anecdotally, you hear that the slowdown in sales has driven less-experienced or marginal agents out of the business. But it's not like every listing is being fronted by a rock star. There are plenty of folks scraping by and, occasionally, scoring – even in this market.
Please see our blog disclaimer.
Listings presented above are supplied via the MLS and are brokered by a variety of agents and firms, not Dave Fratello or Edge Real Estate Agency, unless so stated with the listing. Images and links to properties above lead to a full MLS display of information, including home details, lot size, all photos, and listing broker and agent information and contact information.