A real estate sale flyer made the rounds in MB this week, prompting questions to MBC.
Among other things, the flyer made the claim that sale prices in MB – west of Sepulveda – are up
33.4% year-over-year.
It's obviously fishy, but readers wanted to know – what, exactly is wrong here?
And how are we actually doing,…
A real estate sale flyer made the rounds in MB this week, prompting questions to MBC.
Among other things, the flyer made the claim that sale prices in MB – west of Sepulveda – are up
33.4% year-over-year.
It's obviously fishy, but readers wanted to know – what, exactly is wrong here?
And how are we actually doing, flyers notwithstanding?
It was less than one month ago, and before the close of Q3 2012, that we published our "
Quick Median Price Update," showing median prices
up 4% YTD for all of MB,
flat west of Sepulveda.
Flat, 33%. You know, different people see the data differently, right?
We'll give you a real Q3 update tomorrow.
But first, this flyer. We saw the source info on the claim and instantly knew this would be an easy debunking.
The huge, blinking warning was that these numbers were
one-month comparisons between sales in September 2011 and 2012. And for just west of Sepulveda.
You have to know, that's a small subset of a smallish market.
And just one month! If you had two dozen sales to report on, it'd be a lot.
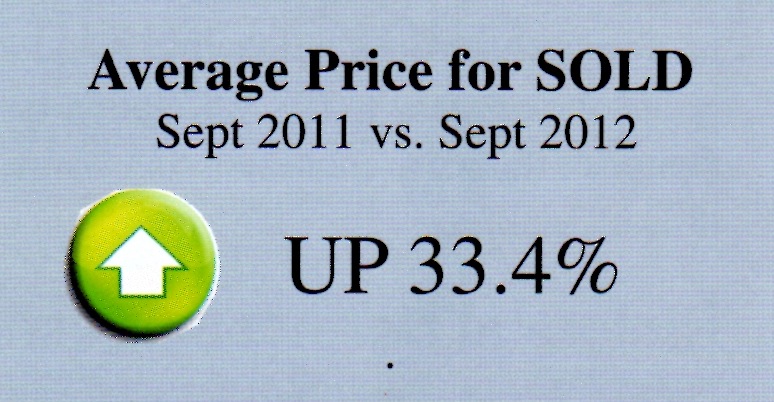
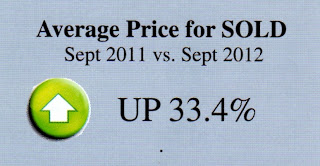
The specific claim was that the "Average Price for SOLD" properties, West of PCH, was "UP 33.4%"
Average price, oh, you bane of analysis. Who uses "average?"
The "average" is so easily skewed by a sale or two that it quickly becomes noise. And in a one-month sample – all the more so.
And that's exactly the first problem.
In Sept. 2011, the top 2 sales west of Sepulveda were at
$4.150m and
$2.181m.
In Sept. 2012, we had 2
Strand sales (hello!) at
$6.2m and
$3.560m. (The $3.5m sale was a condo.) That's a lot of extra lard for the "average" price for September.
Then there's the (fully expected) problem of small samples.
In 2011, there were just
23 residential property sales west of Sepulveda closing in September.
In 2012, there were fewer: just
18.
Obviously, you can't generalize about the MB market based on 18 sales in one month.
For the record, we did our research and found the same numbers "supporting" these claims. You include SFRs and THs west of Sepulveda only, and the jump in "average" sale price is from $1.401m in Sept. 2011 to $1.868m in Sept. 2012, and that's 33.4%.
The median for this alarmingly small sample jumps 27%, instead of the 33% for the average.
Just because both numbers are true doesn't make them relevant.
We'll look at more meaningful data Wednesday.
Please see our blog disclaimer.
Listings presented above are supplied via the MLS and are brokered by a variety of agents and firms, not Dave Fratello or Edge Real Estate Agency, unless so stated with the listing. Images and links to properties above lead to a full MLS display of information, including home details, lot size, all photos, and listing broker and agent information and contact information.