At MBC we present a lot of data in a lot of different ways in an effort to gauge the local RE market's direction.
Our most popular undertaking came earlier this year, as we presented historical median price data going back to 1988. We got a few different stories and graphs and charts out of that deal:
The 90s: What a…
At MBC we present a lot of data in a lot of different ways in an effort to gauge the local RE market's direction.
Our most popular undertaking came earlier this year, as we presented historical median price data going back to 1988. We got a few different stories and graphs and charts out of that deal:
The 90s: What a Drag (1989-2000)
Charting MB's Bubble (2000-2008)
The Whole Enchilada (1989-2008)
(
Hat tip: The data was provided to MBC by a reader who purchased it from DataQuick Information Services.
Thanks again!)
History is great, and the DQ data were useful, but we keep getting the question:
What about now? How is MB doing as we speak?That DQ data ended in March 2008, much too long ago to draw current inferences. So we've gone back to the well and packaged MLS data from 2000-2008 in these new charts. One looks at the whole period, and one hones in on the late bubble years, 2004-2008.
(Click either chart to enlarge.)Please note the caveats and thanks toward the end of this story under "Nerdy Notes."
In short, though, be aware that we are focusing here on a
6-month moving average of monthly median prices for SFRs only. Our source is MLS data. This is an imperfect way to present the medians, but medians are imperfect, too. We still can glean quite a bit.
 What do we see here?
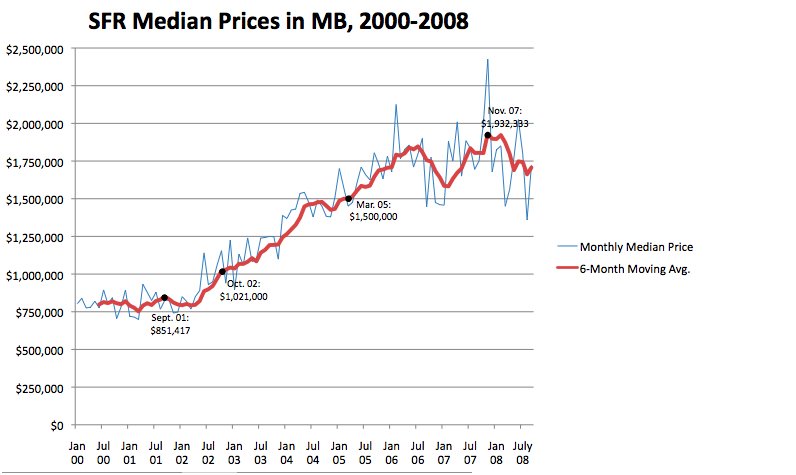
 There is the familiar rocket-fueled upward trajectory in prices in the 2000s, plus a double-peak spanning 2006-07:
- The SFR median hits $1m in about October 2002, and moves steadily upward from there.
- Median prices then rise 50% ($500k) over the next 29 months (Oct. 2002-March 2005).
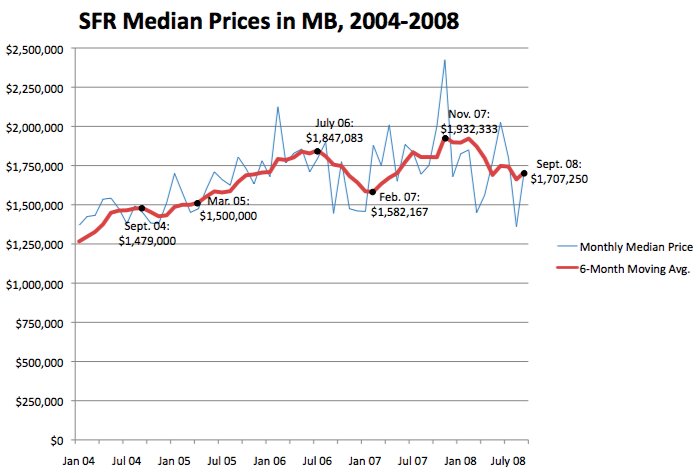
- A first peak is hit in July 2006, another 23% higher (almost $350k) that the March 2005 figure, just 16 months later. [See second chart covering 2004-08.]
- A substantial decline in local median prices for SFRs begins in Summer 2006. Over 7 months, the median drops 14% by Feb. 2007.
- The downward trend reverses for 9 months, and a new peak is reached in Nov. 2007, at $1.932m.
- A new down trend takes hold in 2008, but it's not steep.
- The end-of-September, 6-month median of $1.707m is equivalent to the $1.705m figure last seen in December 2005, almost 3 years ago.
Looking at the totality of 2000-2008, the total rise in the 6-month moving-average median illustrated here is from
$798k in June 2000 (our first data point), to the peak at
$1.932m in Nov. 2007. That's is a jump of $1.132m in the median price in less than 8 years, or a
142% increase.
Interestingly, the boost in medians in the last part of 2007, after the first big wave of financial shocks in Summer 2007, coincided with a sharp decline in sales volume. As an example, the peak month, November, had very few closed sales (
13, far less than the lowest November total of the decade,
24), and a very high single-month median (
$2.450m).
Also, MBC has previously reported that the 4th quarter of 2007 was slower, relative to the first 3 quarters of that year, than all of the 4th quarters going back 20 years (see "
4th Quarter Often Quietest").
That increasing median during 2007, along with a median that is still holding up well today, despite pressures at all levels, presents a question: How has the
sales mix changed, if at all? Are more higher-end homes selling now, relative to other times, as many suspect?
There's no satisfactory way to answer that question, however, even if you've got all the data in front of you. (We don't.) Medians provide perhaps the best indication of what's happening in the market. But they miss a lot of color.
----------------------------
Nerdy notes:First, a caveat. Do not compare these charts to the DQ data from those earlier stories. DataQuick compiled sales data on all residential property transactions in MB, regardless of whether they ever hit the MLS. It's more inclusive, of course. Also, the DQ data included condos and townhomes, not normally part of MBC's coverage.
This selection of MLS data
excludes condos and THs, and obviously misses off-market transactions. Because this median price data only covers SFRs, the numbers are a bit higher. (In other words, including condos and THs mostly drags down median prices.)
Second, another couple of hat tips. First, to Kaye Thomas, who posts these numbers on
her blog on a regular basis for anyone to review and use. And when MBC discovered some discrepancies, she re-ran her numbers and fixed 2007-2008 data discrepancies. Thanks, Kaye!
Also, we got substantial help compiling this info from a reader who responded quite quickly to a request for help. Once we ran into those data discrepancies, we had to slow down again, but we'll be back soon with the fruits of some more of that reader's work, compiling median PPSF data.
Alert readers may note that we previously provided inflation-adjusted figures for the 2000-2008 period alongside the nominal-price figures. This time, we present only nominal price data, i.e., prices in the years in which the sales occurred.
Please see our blog disclaimer.
Listings presented above are supplied via the MLS and are brokered by a variety of agents and firms, not Dave Fratello or Edge Real Estate Agency, unless so stated with the listing. Images and links to properties above lead to a full MLS display of information, including home details, lot size, all photos, and listing broker and agent information and contact information.