It's early still here in 2024, but the local real estate market keeps showing signs of life.
It would be difficult for this year (or any year) to have fewer listings or sales than 2023's lows.
So right now, it's good to see that there are more listings, and more deals being made in January, typically a slow month.
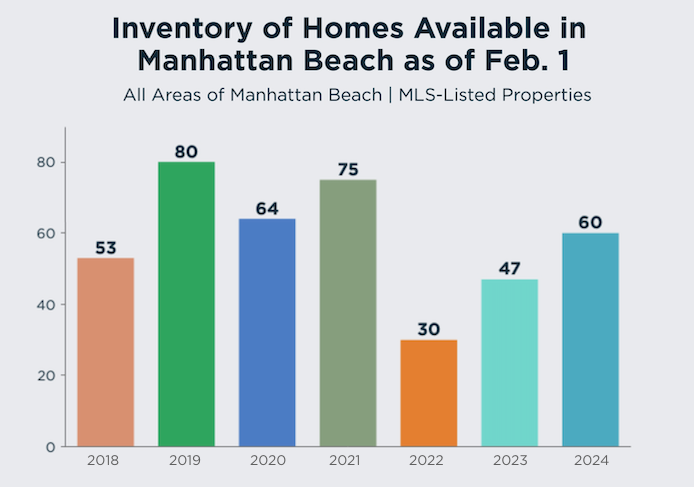
With 60 listings at the start of February, we see a number that is in the range of "normal" among recent years, and well above 2022-23.
We literally have double the inventory of Feb. 1, 2022, and we're up 13 over this time last year.
These boosts over 2022-23 data are not as dramatic as they were in mid-January this year, but that's because inventory has been selling.
Yes, there was a day here in January when we saw inventory hit 72, before it crept back down to 60 at month's end. That had to do with the 18 new deals this past month.
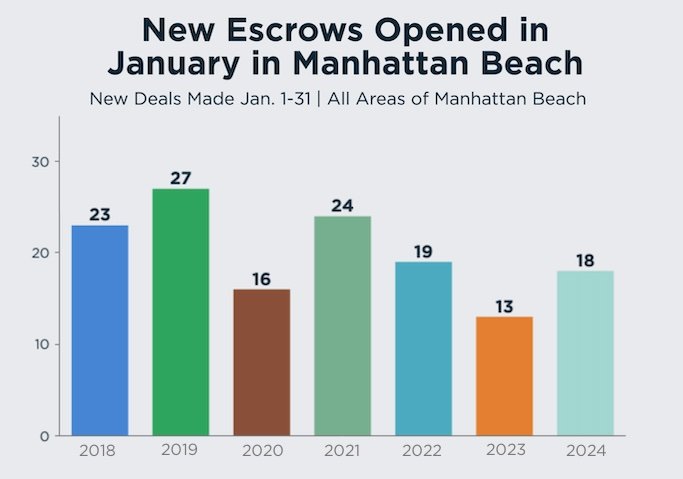
That pace of new escrows is also in the range of "normal," and again better than last year, about the same as 2022.
This year, we're also over 2020's number of new deals for January. That year's data had a big hole in it for March-May, but in Jan. 2020, no one knew that a pandemic was coming, and people were behaving normally. ("No one" and "normally" might be debatable. Discuss.)
The January data don't foretell too much about the year, but buyers, sellers and real estate brokers do watch these numbers for "tea leaves" to try to map out how they year might go.
Anecdotally, it feels like more people are ready to act on plans to buy or sell that they put off in 2023. If conditions appear better, that anecdotal suggestion may bear out.
We'll watch the data.
------------------------------------------------------
Here's the rest of our local real estate market update report for the period ending 1/31/24:
> 60 active listings as of 1/15/24 (-9 from 1/15/24)
> 46 SFRs (-2)
> 14 THs (-7)
See the Inventory list as of 1/31/24 here, or see the MB Dashboard for up-to-the-minute data.
Active listings by region of Manhattan Beach in this report:
> Tree Section: 13 actives (-2)
> Sand Section: 31 actives (-5)
> Hill Section: 6 actives (Flat)
> East MB: 10 actives (-2)
We're also providing a report on closed sales by region of MB.
Sales data, including PPSF for all properties, are organized by sub-region of Manhattan Beach.
Here's a link to the spreadsheet: "MB Pending/Sold as of 1/31/24".
Please see our blog disclaimer.
Listings presented above are supplied via the MLS and are brokered by a variety of agents and firms, not Dave Fratello or Edge Real Estate Agency, unless so stated with the listing. Images and links to properties above lead to a full MLS display of information, including home details, lot size, all photos, and listing broker and agent information and contact information.

