Real news now... :)
The first quarter of 2021 in Manhattan Beach real estate did not smash records for sales activity, but it was really good.
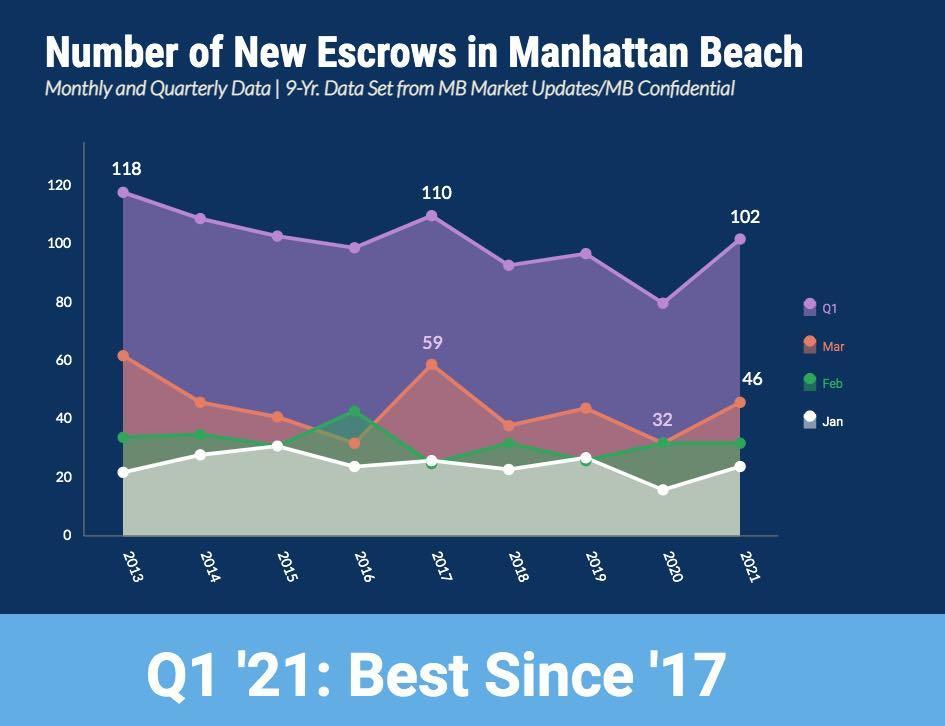
The sales pace was notably better than the equivalent period last year, and the best since blistering Q1 2017.

We can compare March to March, 2020 to 2021, and…
Real news now... :)
The first quarter of 2021 in Manhattan Beach real estate did not smash records for sales activity, but it was really good.
The sales pace was notably better than the equivalent period last year, and the best since blistering Q1 2017.

We can compare March to March, 2020 to 2021, and see that the number of new deals inked here in town rose from 32 last year to 46 within the one month this year. But this would also be the first year-over-year comparison where we have to account for the pandemic shutdown that clouded the second half of March 2020.
We recorded only 10 new escrows opening last year, from March 16-31, 2020, against an average in the mid-20s for recent years for the second half of March. There were 26 this year. So the lag, post-shutdown in 2020, was roughly 15 deals.
You can see at the bottom of our new chart that January 2021 was better than the year prior, and February equal.
The overall Q1 2021 total of 102 new escrows was a big jump over 80 total for Q1 2020.
Now, this is not all to say that things are "normal" or "quiet" or "steady" right now in the market. In our day-to-day practice, it feels positively frenetic. We keep telling you: These are long days. They start early and end suddenly on a pillow, when you just can't go anymore.
Maybe that's the Edge team raising its game (yes, we're doing that), but also the market is drawing us into new activity daily. People want to do business. You see it in the stats, and in our long days.
Our first look at the median price for Manhattan Beach shows a big rise to $2.700M, another all-time record. It was at $2.600M at year end 2020.
We like to wait a few days before considering the median price final. Sometimes sales that technically closed a few days before month's end get posted to the MLS later. We'll revisit the median price data later in April.
Meantime, if you like our chart up above, but wish you could see the individual data points, you can! Scroll below the stats just below here, and you'll see a version of the chart that lets you check individual months and years for the number of new escrows, to get a complete picture.
Here's the rest of our local real estate market update report for the period ending 3/31/21:
> 82 active listings as of 3/31/21 (+4 from 3/15/21)
> 54 SFRs (+5)
> 28 THs (-1)
See the Inventory list as of 3/31/21 here, or see the MB Dashboard for up-to-the-minute data.
Active listings by region of Manhattan Beach in this report:
> Tree Section: 14 actives (Flat)
> Sand Section: 46 actives (+5)
> Hill Section: 6 actives (Flat)
> East MB: 16 (-1)
We're also providing a report on closed sales by region of MB.
Sales data, including PPSF for all properties, are organized by sub-region of Manhattan Beach.
Here's a link to the spreadsheet: "MB Pending/Sold as of 3/31/21".
And here's that chart we promised that you can roll over to get individual monthly stats:
#q12021#
Please see our blog disclaimer.
Listings presented above are supplied via the MLS and are brokered by a variety of agents and firms, not Dave Fratello or Edge Real Estate Agency, unless so stated with the listing. Images and links to properties above lead to a full MLS display of information, including home details, lot size, all photos, and listing broker and agent information and contact information.


