What a difference a year makes.
One year ago, local real estate had gone into a deep freeze, induced by the stay-at-home orders meant to limit the spread of COVID-19.
Here are a few ways to look at contrasts since then.
More Q1 Home Sales
The first quarter of 2020 was definitely impacted, as March…
What a difference a year makes.
One year ago, local real estate had gone into a deep freeze, induced by the stay-at-home orders meant to limit the spread of COVID-19.
Here are a few ways to look at contrasts since then.
More Q1 Home Sales
The first quarter of 2020 was definitely impacted, as March home sales trailed off. Several homes that were in escrow fell out. Others simply extended to see what the COVID impact on the economy and housing might be.
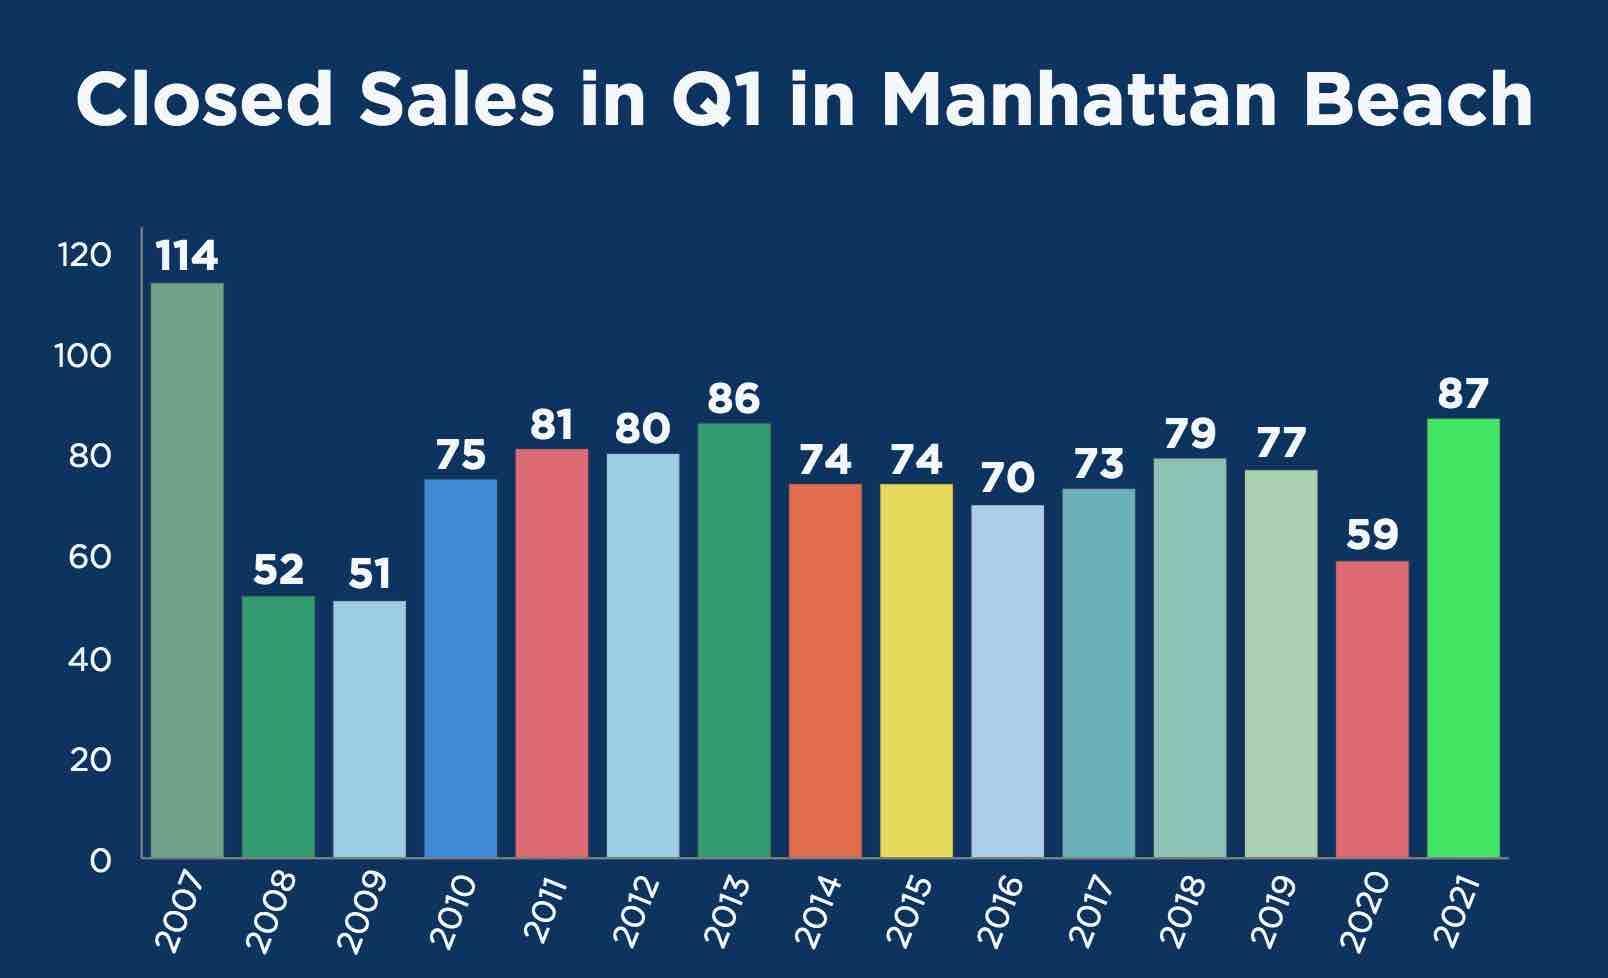
Q1 2020 was then the worst since 2008-09, and if you're a year, you don't want your econ stats compared to that period.

Fast forward to now, and Q1 2021 was the best since 2007. (Beating 2013 by one closed sale.)
With 87 closed sales, this year's Q1 saw a 47% increase over last year's battered numbers.
This year can only look back to crazy-cray 2007, the last gasp of the hard-charging mid-oughts market, before multiple markets around the country crashed and local real estate eventually floundered, too.
Pending Sales Triple
 You know to be careful comparing stats to last year, right?
We can isolate a number and make it look pretty astonishing.
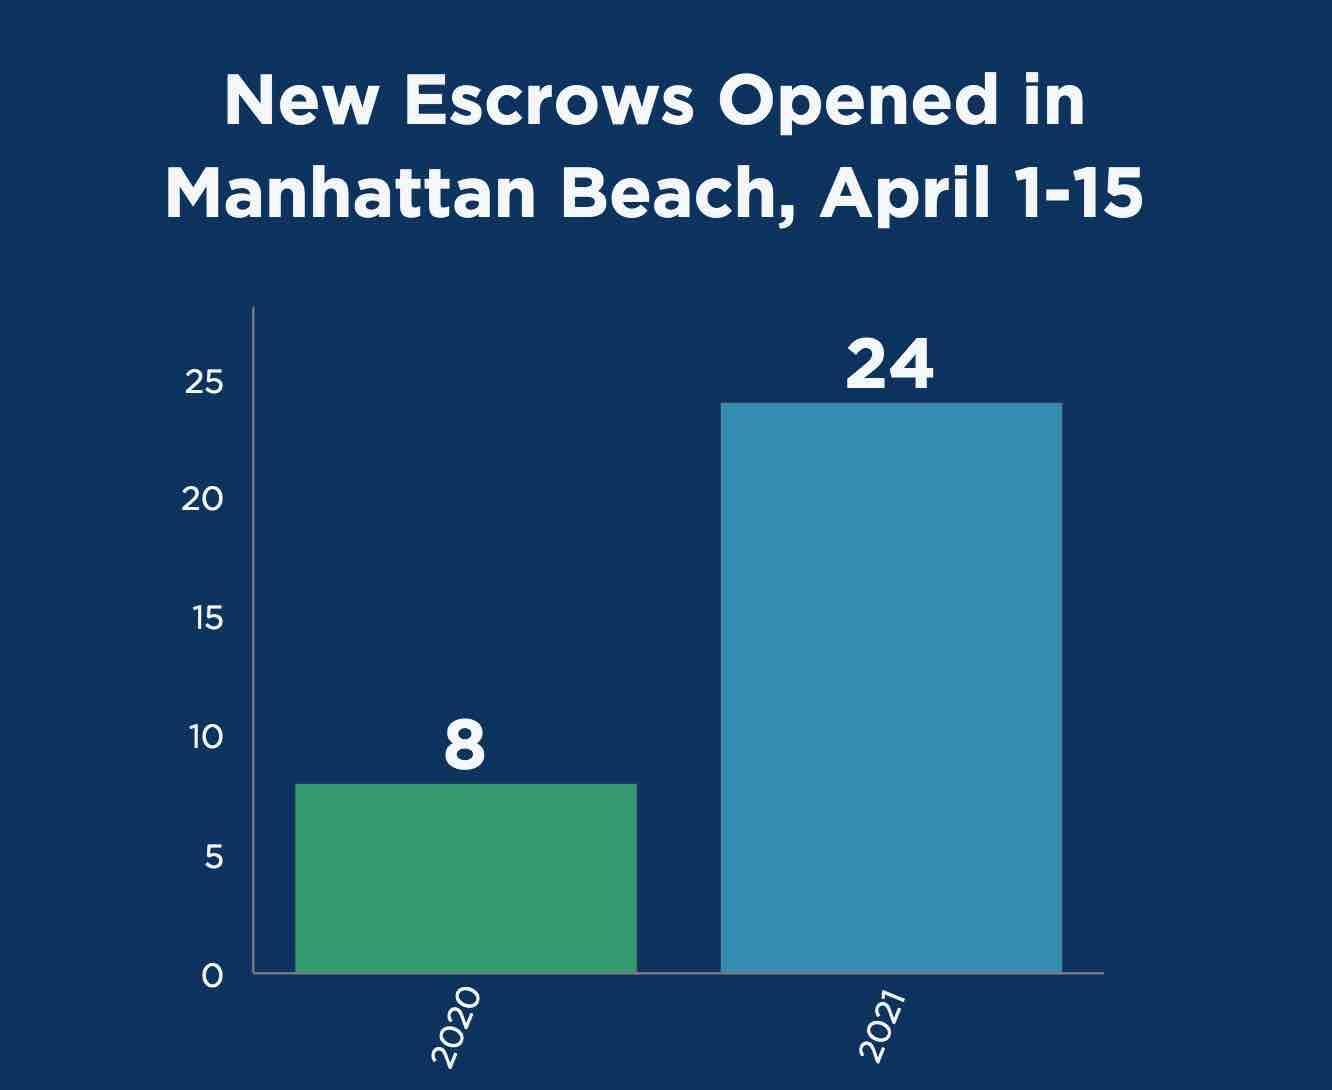
In the period of April 1-15, last year there were only 8 new escrows opened in all of Manhattan Beach.
This year, 24. That's triple last year's statistic!
But then, we're sure that this year, ice cream cone sales have doubled over last year, jaywalking tickets have tripled, beach visits have 20-tupled, and so on, because it was just different last year at this time.
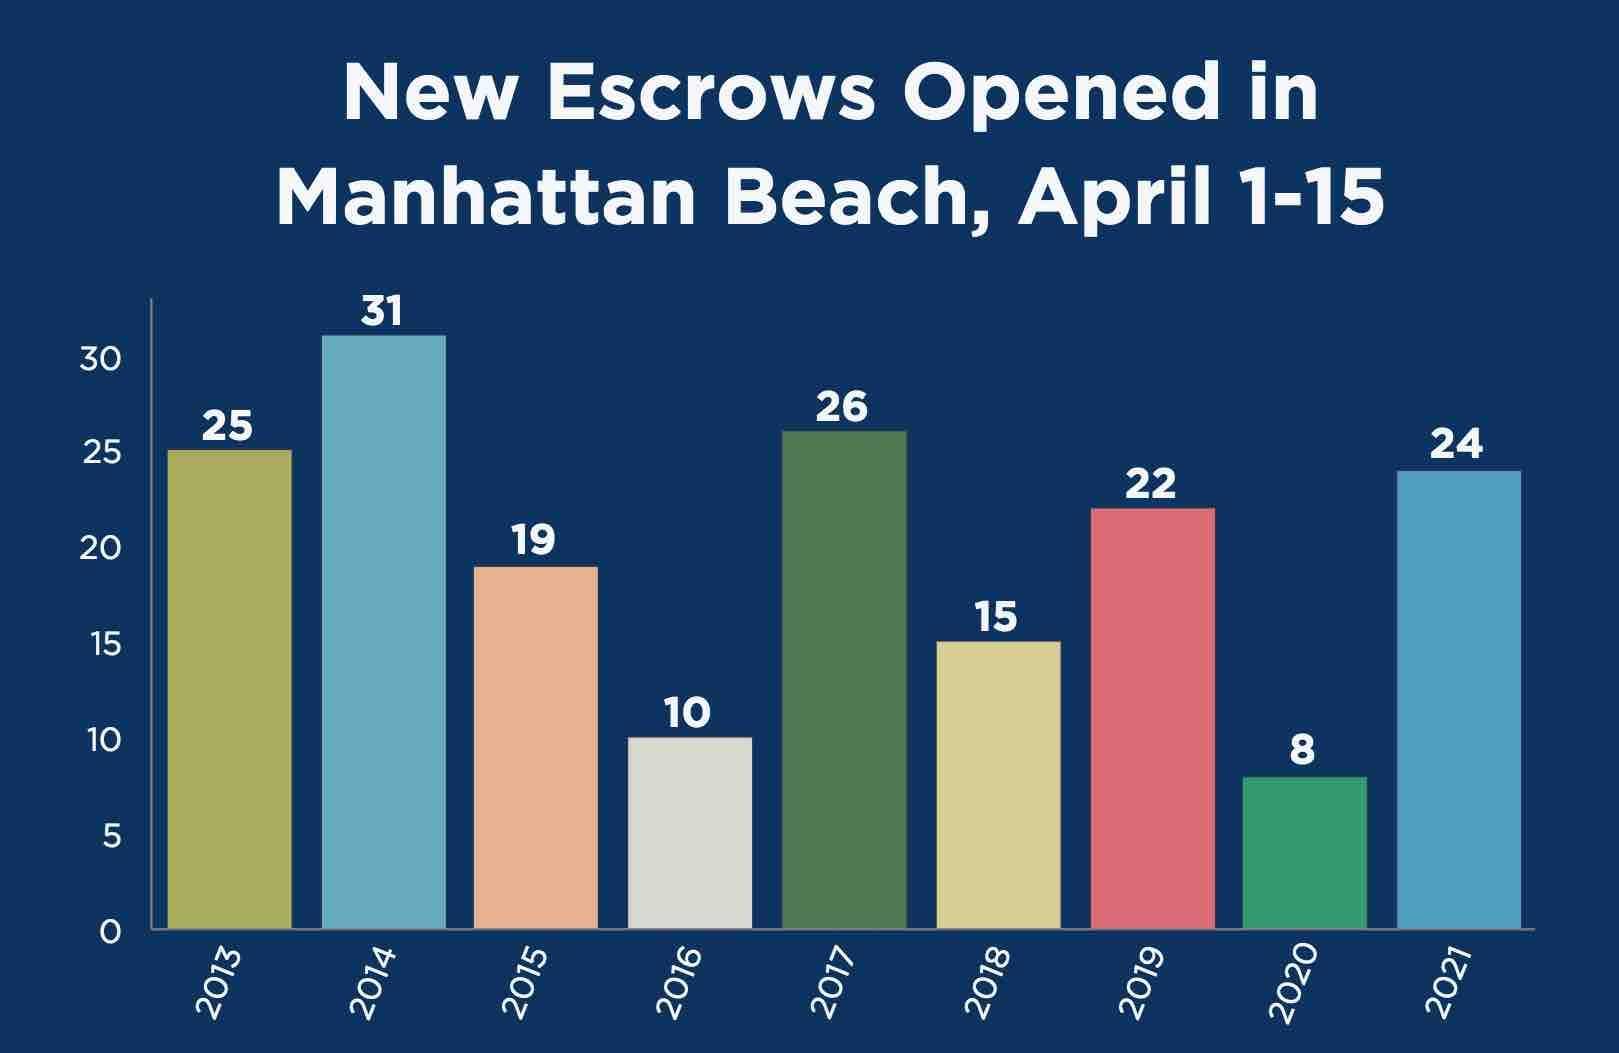
We can put the first half of April in a bit better context in this chart:

OK, so this little snapshot of the first half of April looks a little more normal now.
And, with a few draggy years besides COVID-hammered 2020, we can see that this short period of time does have some statistical unpredictability.
Inventory: Kinda Normal
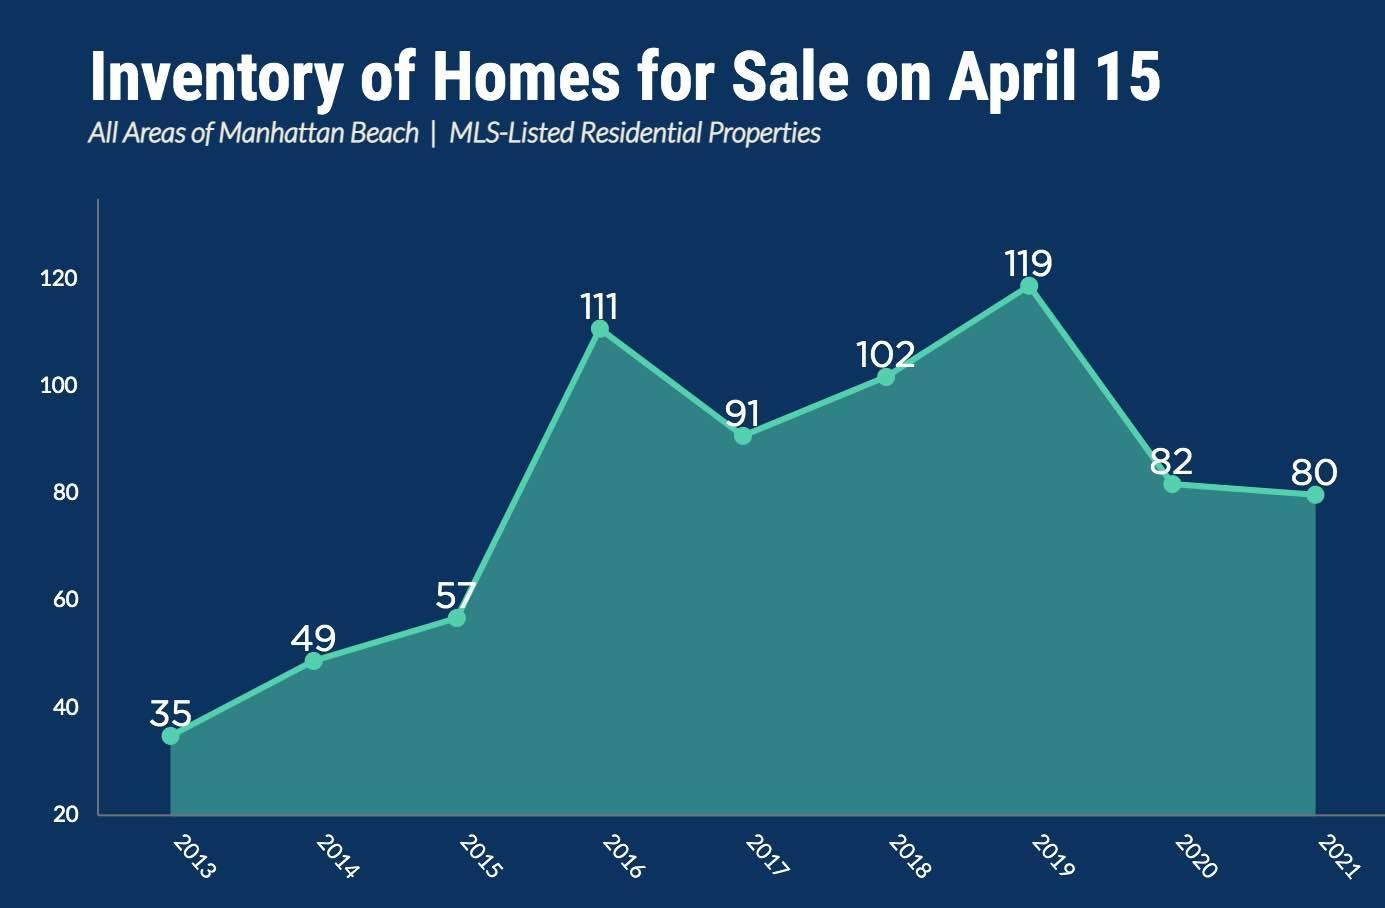
At this time last year, inventory hung at 82 listings in Manhattan Beach.
Sales activity had all but ended, and new listings were not coming out.
This year, we see 12-15 new listings each week, sales are brisk, and inventory is... about the same, at 80.

These two markets, one year apart, couldn't feel more different, but on this one point, they look almost equivalent.
The good news on one front is that a 4-year trend of frequently higher inventory at this time of year now seems broken.
The market had its sluggish periods and warning signs through parts of 2016-19. The proverbial "other shoe" never really dropped during that period, other than the fact that the median price for Manhattan Beach homes retracted slightly at year-end 2019.
Tighter inventory now is not exactly a warning sign.
Here's the rest of our local real estate market update report for the period ending 4/15/21:
> 80 active listings as of 4/15/21 (-2 from 3/31/21)
> 52 SFRs (-2)
> 28 THs (Flat)
See the Inventory list as of 4/15/21 here, or see the MB Dashboard for up-to-the-minute data.
Active listings by region of Manhattan Beach in this report:
> Tree Section: 12 actives (-2)
> Sand Section: 44 actives (-2)
> Hill Section: 6 actives (Flat)
> East MB: 18 (+2)
We're also providing a report on closed sales by region of MB.
Sales data, including PPSF for all properties, are organized by sub-region of Manhattan Beach.
Here's a link to the spreadsheet: "MB Pending/Sold as of 4/15/21".
Please see our blog disclaimer.
Listings presented above are supplied via the MLS and are brokered by a variety of agents and firms, not Dave Fratello or Edge Real Estate Agency, unless so stated with the listing. Images and links to properties above lead to a full MLS display of information, including home details, lot size, all photos, and listing broker and agent information and contact information.


 You know to be careful comparing stats to last year, right?

