We have about half the inventory this year as we did last year, 72 listings at mid-month versus 137 last year.
Last year was plenty busy, but it would take time to work through the inventory and deal with the rush of delayed or opportunistic listings that emerged all Summer long into a busy Fall.
 Today,…
We have about half the inventory this year as we did last year, 72 listings at mid-month versus 137 last year.
Last year was plenty busy, but it would take time to work through the inventory and deal with the rush of delayed or opportunistic listings that emerged all Summer long into a busy Fall.
Today, the pace at which listings are coming off the board is swift, plus there are fewer homes to buy at any given time.
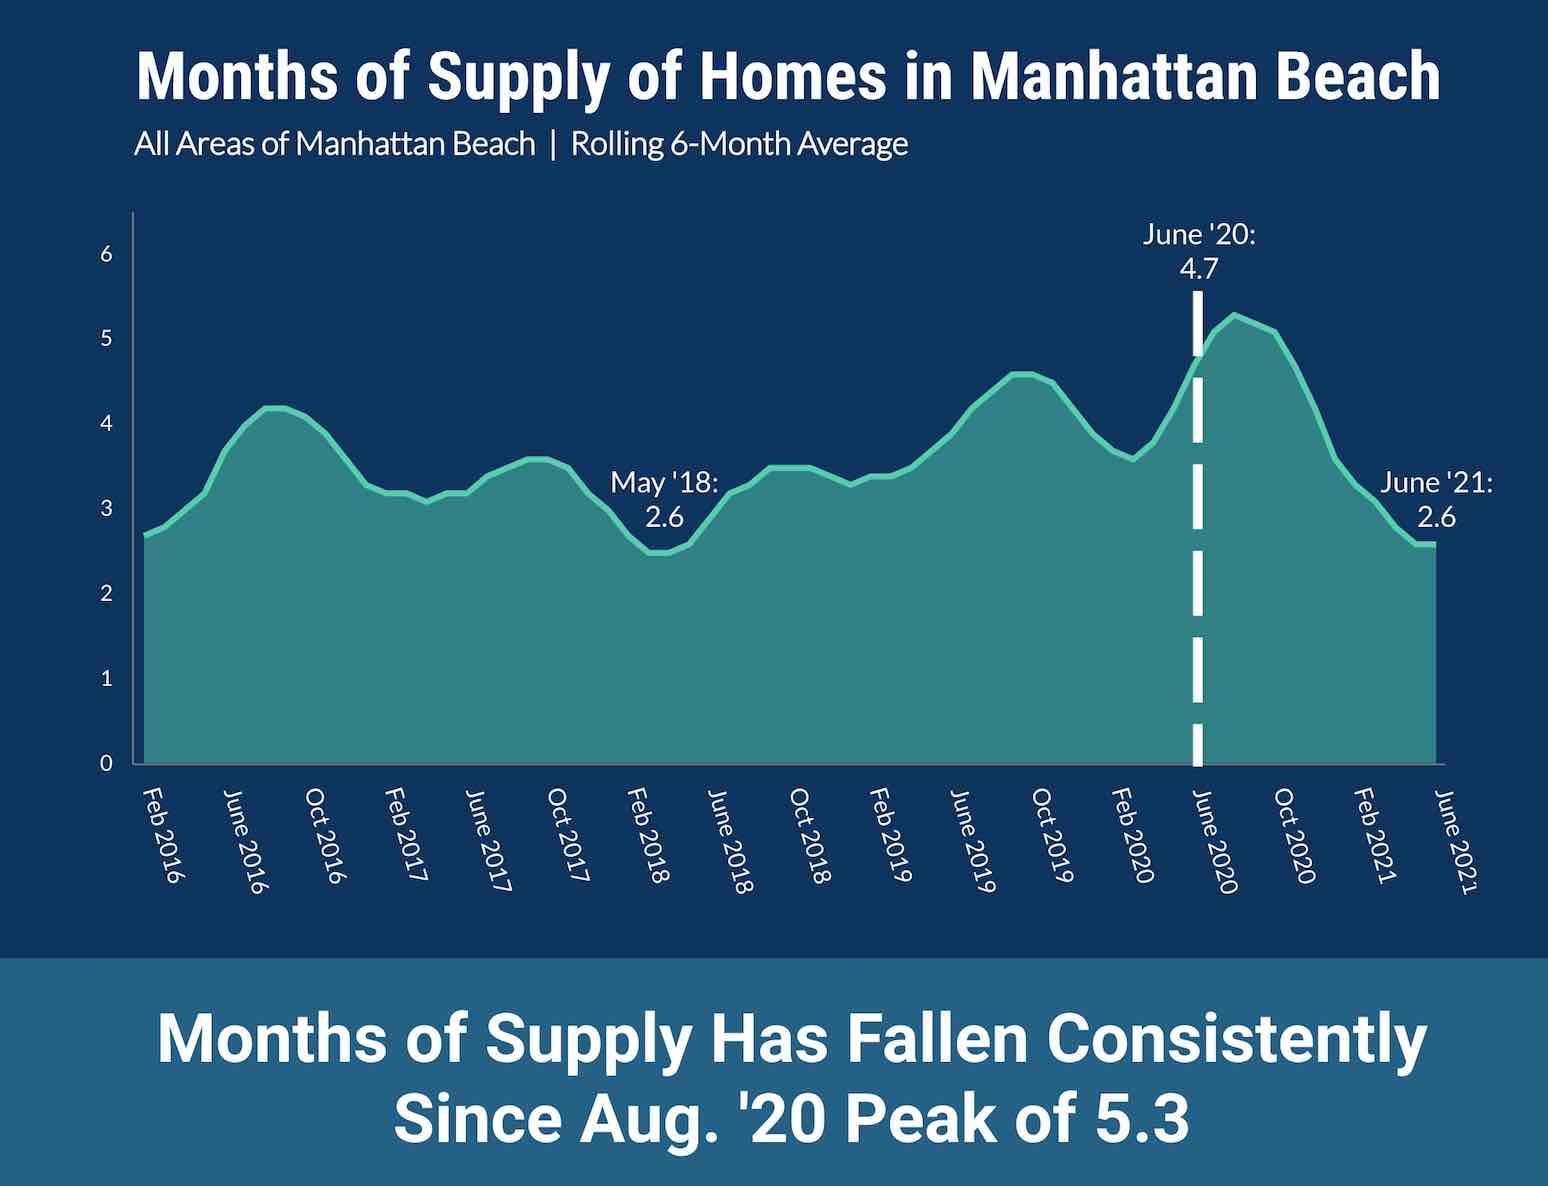
Indeed, at this time, it would take only 2.6 months for all the inventory in town to be sold.
This is the measure known as "months of supply," which takes into account the number of homes going into escrow and current inventory, then estimates how long it would take to sell everything in the market.
This pace has buyers devouring current inventory basically twice as fast as last Summer. In June 2020, there were 4.7 months of supply, rising to 5.3 months in August.
The last time months of supply was this low was May 2018, as noted on our chart.
Not seen on this chart: The number can, indeed, go lower. Usually not in Summer, but all bets are off this year.
From Dec. 2012-Sept. 2015, a period of nearly 3 full years, months of supply was even lower than today's figure of 2.6 months.
Indeed, for 17 straight months of 2013-14, the Manhattan Beach real estate market held less than 2 months of supply at any given moment. (In case you're wondering what an even tighter market feels like.)
So we've witnessed a stunning dropoff in months of supply, but there is room down below if trends continue, even through these traditionally sleepier Summer months.
Here's the rest of our local real estate market update report for the period ending 7/15/21:
> 72 active listings as of 7/15/21 (+5 from 6/30/21)
> 55 SFRs (+4)
> 17 THs (+1)
See the Inventory list as of 7/15/21 here, or see the MB Dashboard for up-to-the-minute data.
Active listings by region of Manhattan Beach in this report:
> Tree Section: 19 actives (+5)
> Sand Section: 33 actives (+2)
> Hill Section: 7 actives (-1)
> East MB: 13 (-1)
We're also providing a report on closed sales by region of MB.
Sales data, including PPSF for all properties, are organized by sub-region of Manhattan Beach.
Here's a link to the spreadsheet: "MB Pending/Sold as of 7/15/21".
Please see our blog disclaimer.
Listings presented above are supplied via the MLS and are brokered by a variety of agents and firms, not Dave Fratello or Edge Real Estate Agency, unless so stated with the listing. Images and links to properties above lead to a full MLS display of information, including home details, lot size, all photos, and listing broker and agent information and contact information.


