While we are looking at mid-July data, we'll also catch up on some more first-half stats for Manhattan Beach real estate.
It seems important to say, once again, that current local data don't yet show any kind of market slowdown, despite the "buzz" about that topic almost everywhere.
 To wit, Tuesday's LA…
While we are looking at mid-July data, we'll also catch up on some more first-half stats for Manhattan Beach real estate.
It seems important to say, once again, that current local data don't yet show any kind of market slowdown, despite the "buzz" about that topic almost everywhere.
 To wit, Tuesday's LA Times carried an article stoking concern that home prices are declining. The article cites DQ News data for the 6-county region of Southern California. The median price of homes for this vast region was down by $10K to $750K from May to June 2022.
Month over month?
We wouldn't do that locally, for sure. If we use a tiny data set like May-to-June 2022 in Manhattan Beach only, we see the median price jump by $1 million (!) from $2.625M in May to $3.625M in June. (Based on 35 and 33 sales, respectively.)
But a 6-county region brings an absolutely gigantic data set, more than 20,000 home sales, so maybe it's OK to take note of a month-to-month trend.
The Times writer offers a bit of data-rooted prognostication: "Before home values truly fall, they must first slow. And that slowdown appears to be starting."
 Again, bringing things local, we don't find a reliable way to spot recent price declines in Manhattan Beach.
The Manhattan Beach median home price as of June 30, 2022, was $3.100M, a record high, using a (traditional) full 12 months' worth of data.
If we shorten the time period, then more volatile data sets can show some drops, if you want to play that game.
If we use only 6 months' worth of data, the median is $3.125M - even higher than the 12-month record! - but down from a Feb. 2022 median price of $3.200M.
If we try just 3 months' worth of data, the median is $3.150M - higher again! - but down from $3.300M in Nov. 2021.
Obviously, the numbers bounce around with smaller data samples, as few as 100 or so sales for that 3-month sample. We never report using such limited figures, but in context here, we thought to share.
-----------------
We like to take a look at some interesting recent sales each period.
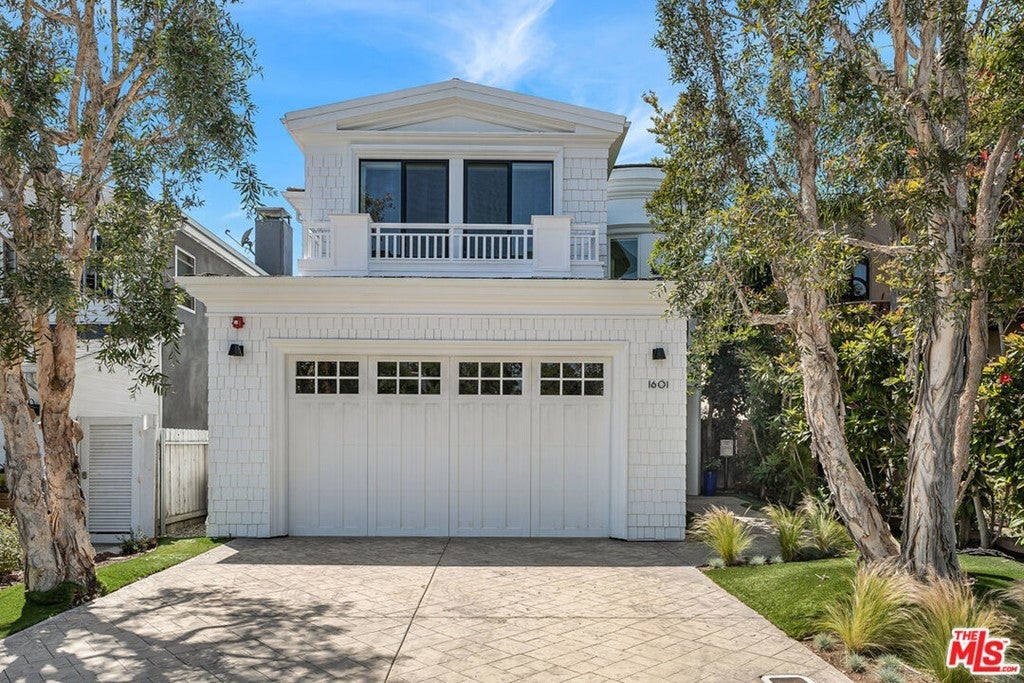
 1601 Pine (5br/5ba, 2962 sqft.) sets some kind of record here with a sale at $4.200M.
The recently completely and totally reworked 2011 build closed at $1,418/PSF, a figure made larger by the home's being a little undersized (<3000 sqft.).
Only twice ever have livable homes on a single lot in the Tree Section ever fetched a higher PPSF. And they were in ultra-prime neighborhoods at far higher prices:
641 18th (4br/3ba, 3796 sqft., ~7000 sqft. lot) at $7.850M ($2,068/PSF, June '21), and
616 12th (5br/5ba, 4300 sqft., new construx) at $6.500M ($1,512/PSF, Apr. '22)
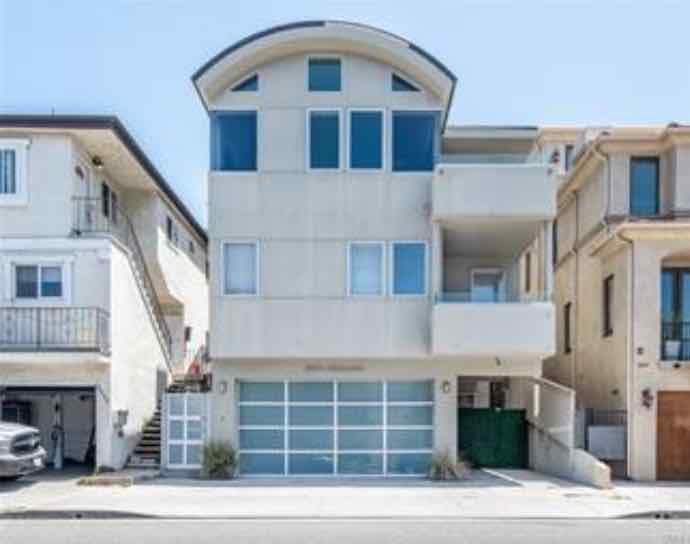
 Also, take a look at 2804 Highland (4br/4ba, 2398 sqft.)
This is a modern Sand Section SFR with views.
It listed at $3.499M in early June and needed just 3 DOM to get bid up.
Closed price: $3.650M.
It's all the more remarkable, given that a "slowdown" is in the air, but the very recent market experience of the same property was so greatly different.
As the market rocketed up in July 2020, this home came out at $3.335M.
After 6 months on market and 2 public price cuts, the home finally sold for $3.075M, or 8% under asking.
That was a hot market!
This time, in a "moment of concern," the same house sells in the blink of an eye and 4% over asking, not to mention 19% higher than its sale price just 18 months ago.
Here's the rest of our local real estate market update report for the period ending 7/15/22:
> 60 active listings as of 7/15/22 (+1 from 6/30/22)
> 49 SFRs (+3)
> 11 THs (-2)
See the Inventory list as of 7/15/22 here, or see the MB Dashboard for up-to-the-minute data.
Active listings by region of Manhattan Beach in this report:
> Tree Section: 12 actives (+5)
> Sand Section: 23 actives (-6)
> Hill Section: 12 actives (+2)
> East MB: 13 (flat)
We're also providing a report on closed sales by region of MB
Sales data, including PPSF for all properties, are organized by sub-region of Manhattan Beach.
Here's a link to the spreadsheet: "MB Pending/Sold as of 7/15/22".
Please see our blog disclaimer.
Listings presented above are supplied via the MLS and are brokered by a variety of agents and firms, not Dave Fratello or Edge Real Estate Agency, unless so stated with the listing. Images and links to properties above lead to a full MLS display of information, including home details, lot size, all photos, and listing broker and agent information and contact information.

 Again, bringing things local, we don't find a reliable way to spot recent price declines in Manhattan Beach.
 Also, take a look at