 It happened again.
The relentlessly rising Manhattan Beach median home price has relentlessly risen, this time in July.
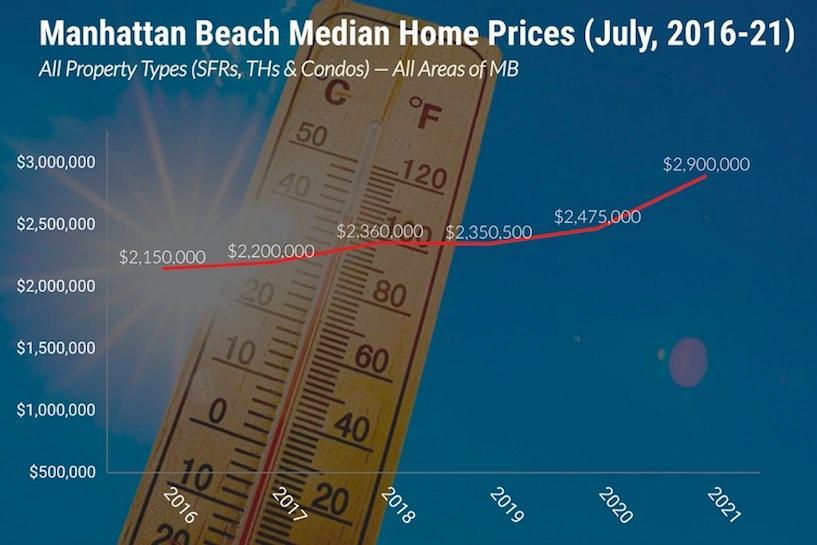
The new median price: $2.900M.
It's a cool $100K jump over the June 2021 median price. (So, so long ago. See our 6/30/21 update for more, with different charts.)
This is a 23% rise…
 It happened again.
The relentlessly rising Manhattan Beach median home price has relentlessly risen, this time in July.
The new median price: $2.900M.
It's a cool $100K jump over the June 2021 median price. (So, so long ago. See our 6/30/21 update for more, with different charts.)
This is a 23% rise over July 2019, 17% over last year.
The numbers may look silly, but all over Manhattan Beach, you see willing buyers with money lining up to pay these prices and competing against one other to drive prices up further.
Sales closing in July would typically represent the tail end of the "Spring market," a bit of the early Summer. Although received wisdom has been that Summer is slower, and you could see a lag down the road, let's not assume any of the old rules apply - for the moment.
Inventory is incredibly tight (down 7 listings from just 2 weeks ago), and money is cheap.
We won't betray confidences, but to see the numbers people are getting on mortgages... those numbers are very low, and may support a degree of insensitivity to price for some buyers. Rates aren't the only factor, but if they weren't awe-inspiringly low, what would this market do?
A sub-point: Not only is inventory down, inventory of SFRs dropped even more overall this period. Plenty of people can love and live in a townhome, but many demand SFRs. They're scarcer now. Yikes.
Here's the rest of our local real estate market update report for the period ending 7/31/21:
> 65 active listings as of 8/1/21 (-7 from 7/15/21)
> 44 SFRs (-11)
> 21 THs (+4)
See the Inventory list as of 7/31/21 here, or see the MB Dashboard for up-to-the-minute data.
Active listings by region of Manhattan Beach in this report:
> Tree Section: 15 actives (-4)
> Sand Section: 34 actives (+1)
> Hill Section: 5 actives (-2)
> East MB: 11 (-2)
We're also providing a report on closed sales by region of MB
Sales data, including PPSF for all properties, are organized by sub-region of Manhattan Beach.
Here's a link to the spreadsheet: "MB Pending/Sold as of 7/31/21".
Please see our blog disclaimer.
Listings presented above are supplied via the MLS and are brokered by a variety of agents and firms, not Dave Fratello or Edge Real Estate Agency, unless so stated with the listing. Images and links to properties above lead to a full MLS display of information, including home details, lot size, all photos, and listing broker and agent information and contact information.
Based on information from California Regional Multiple Listing Service, Inc. as of July 27th, 2024 at 3:55am PDT. This information is for your personal, non-commercial use and may not be used for any purpose other than to identify prospective properties you may be interested in purchasing. Display of MLS data is usually deemed reliable but is NOT guaranteed accurate by the MLS. Buyers are responsible for verifying the accuracy of all information and should investigate the data themselves or retain appropriate professionals. Information from sources other than the Listing Agent may have been included in the MLS data. Unless otherwise specified in writing, Broker/Agent has not and will not verify any information obtained from other sources. The Broker/Agent providing the information contained herein may or may not have been the Listing and/or Selling Agent.

 It happened again.
