We ended 2017 with upbeat data for the Manhattan Beach real estate market, even if we're still struggling with crappy news from the tax-law front.
 As we have noted, total sales for the year were the best in a few years. We're now revising the total of 421 - which was a tie with 2014 - to 422, based on one…
We ended 2017 with upbeat data for the Manhattan Beach real estate market, even if we're still struggling with crappy news from the tax-law front.
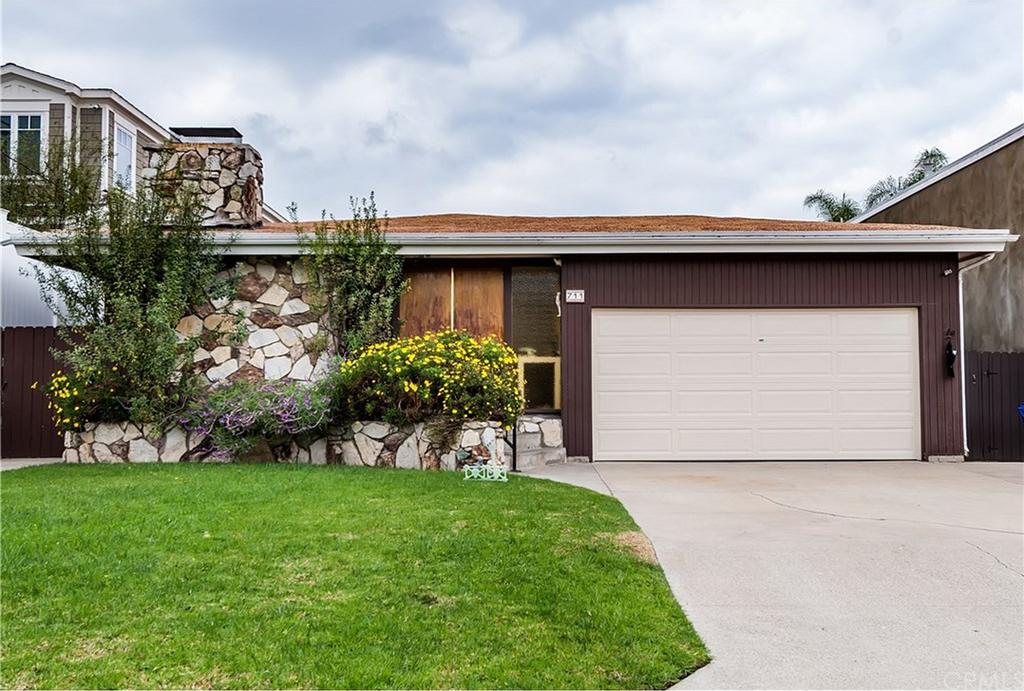
As we have noted, total sales for the year were the best in a few years. We're now revising the total of 421 - which was a tie with 2014 - to 422, based on one late-reported sale that occurred within the year. (We're looking at you, 711 Larsson [sold for $1.720M].)
That means 2017 was higher by 1 than 2014, in addition to being a few percentage points higher than 2015 and 2016 in overall sales. (See "Highest & Lowest Sales of 2017 in Manhattan Beach.")
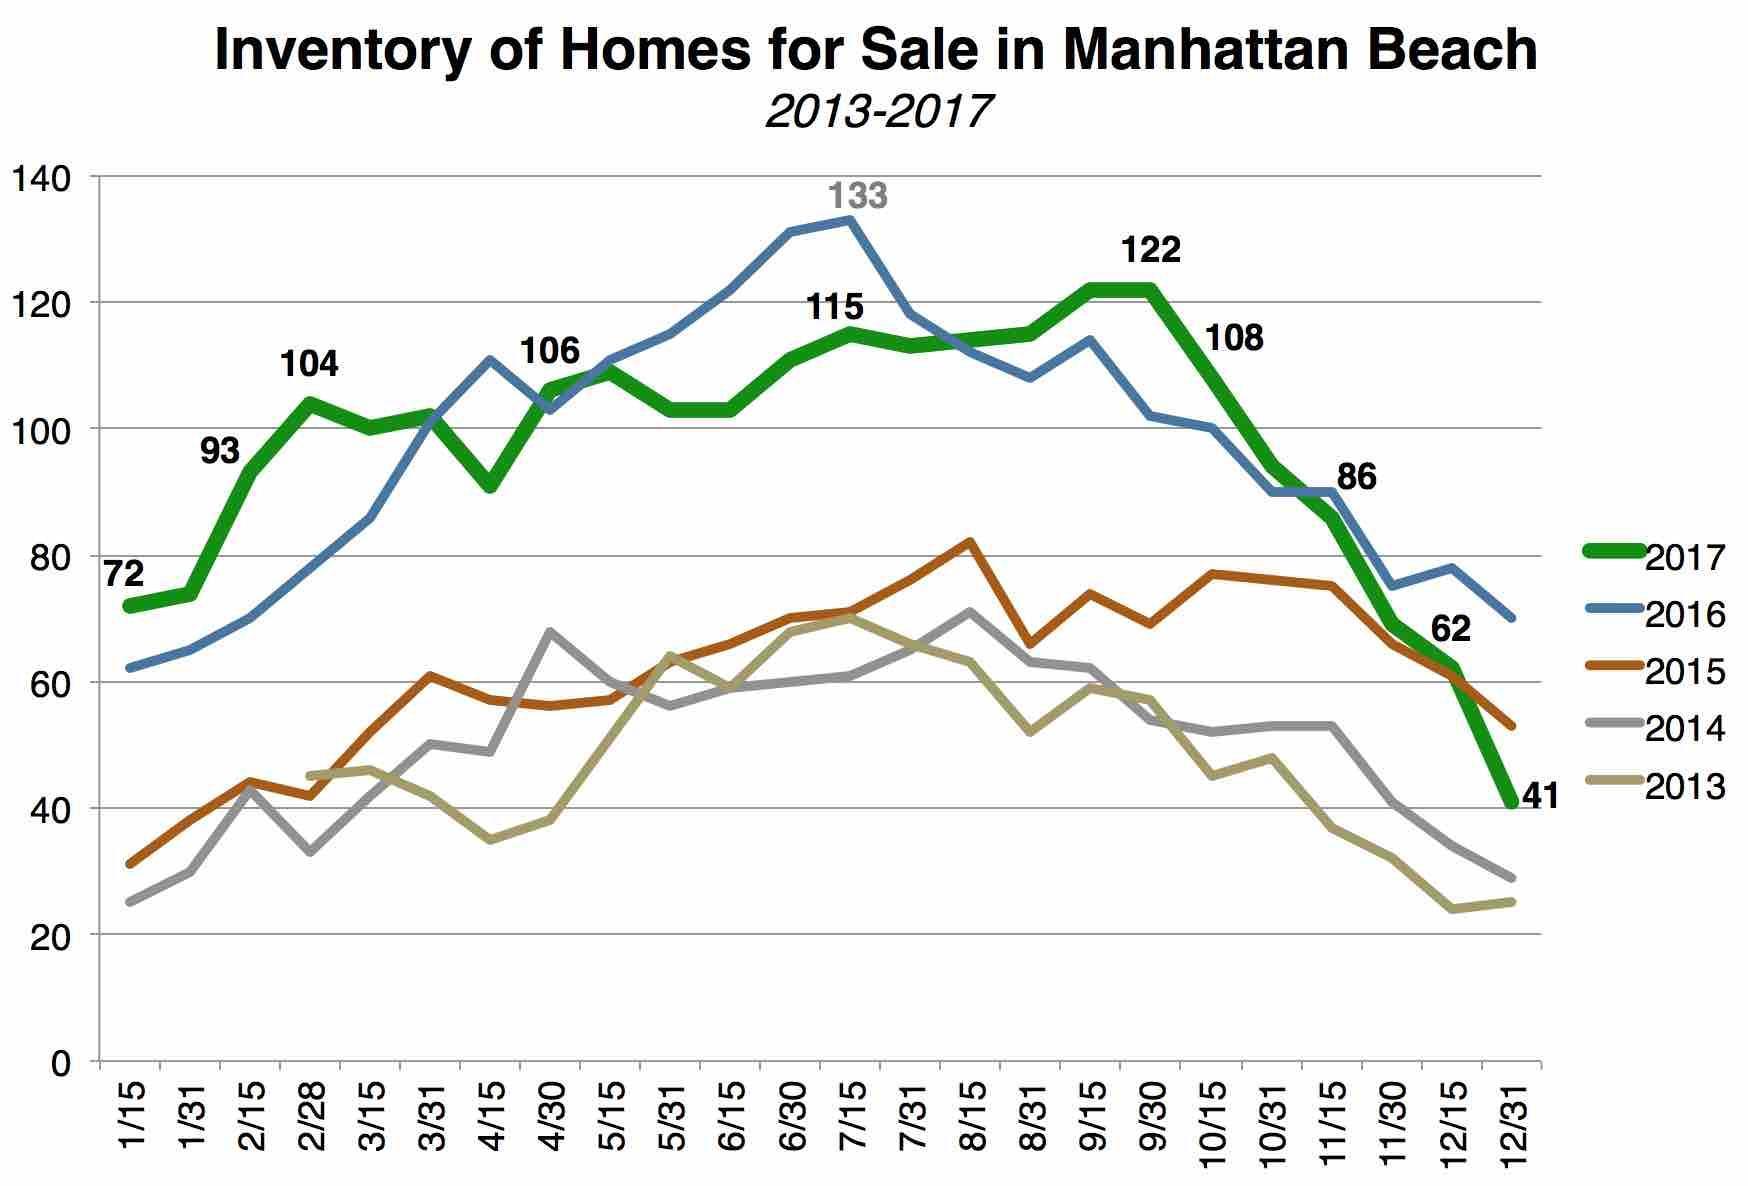
We can also now show you (in our chart above), that real estate inventory dropped like a rock throughout the 4th quarter.
Yes, inventory always pulls back for the holiday season, but this was unusual - a steeper downtrend that ended quite a bit lower than at the same point for 2015-16 at just 41 listings for year end.
Yes, inventory was lower at the end of 2013 and 2014, but the peaks and Autumn starting points then were lower, too. Year-end saw about half the number of listings from October 1 of each year. At the end of 2017, we were at only one-third of the Oct. 1 point (122).
Throughout the year, 2017's inventory total has bounced around, sometimes much higher than 2016, sometimes lower, but usually much closer to 2016 data than any other recent year. In late December, for the first time, 2017 had fewer listings than 2015, also. Wow.
Looking back doesn't tell us a lot, but these data do raise the possibility that 2018 could be a lower-inventory year. That might be good news for sellers in a year that could be challenging overall from the sell side.
The late part of the year saw a few Tree Section Mediterraneans sell, and these provide some interesting data points.
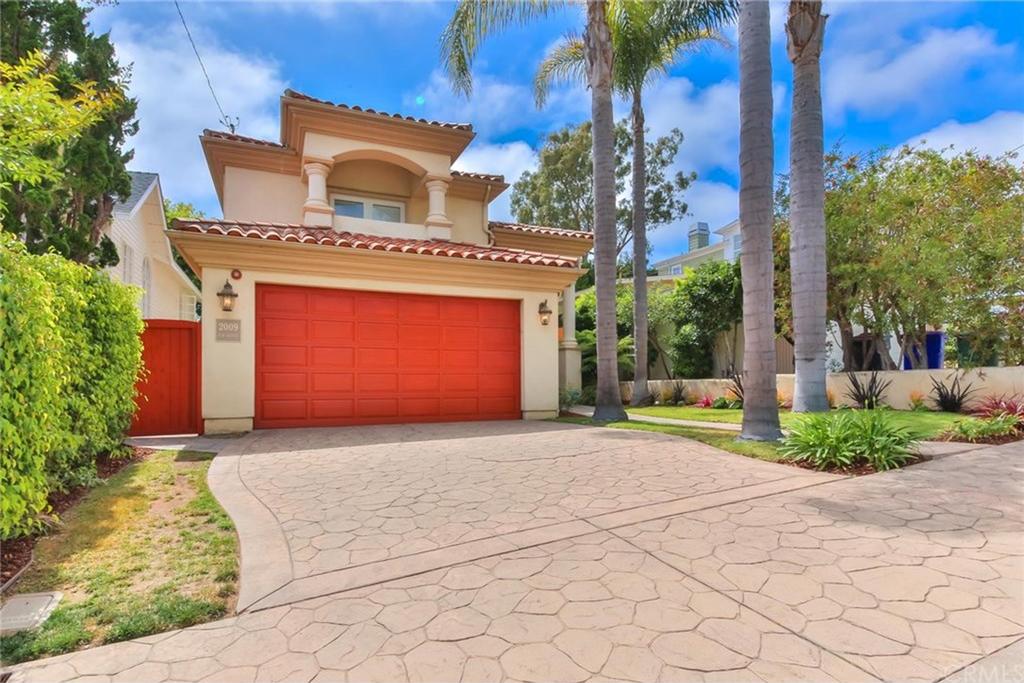 There was 2009 Elm (4br/3ba, 3100 sqft.), a late-90s build that was clean and simple, largely original, though.
The sold price of $2.262M was a 20% boost over the 2013 purchase price, but almost $300K (and 11%) below the start price of $2.549M.
It was also the lowest comp among Tree Section Mediterraneans since a much more location-challenged early-90s home at 3600 Pacific (4br/3ba, 3300 sqft.) sold for $2.000M in March.
Mid-2000s Mediterraneans at 3008 Elm and 2509 Walnut had gone for $2.473M and $2.500M, respectively, also early in the year. A custom 2003 Old-World-inspired Mediterranean at 2615 Laurel had gone for $2.760M, while the super-remodeled 3408 Poinsettia got $2.600M.
In late November, as if to hold up that mid-2's price point, the lightly updated Mediterranean at 2304 Elm closed for $2.500M.
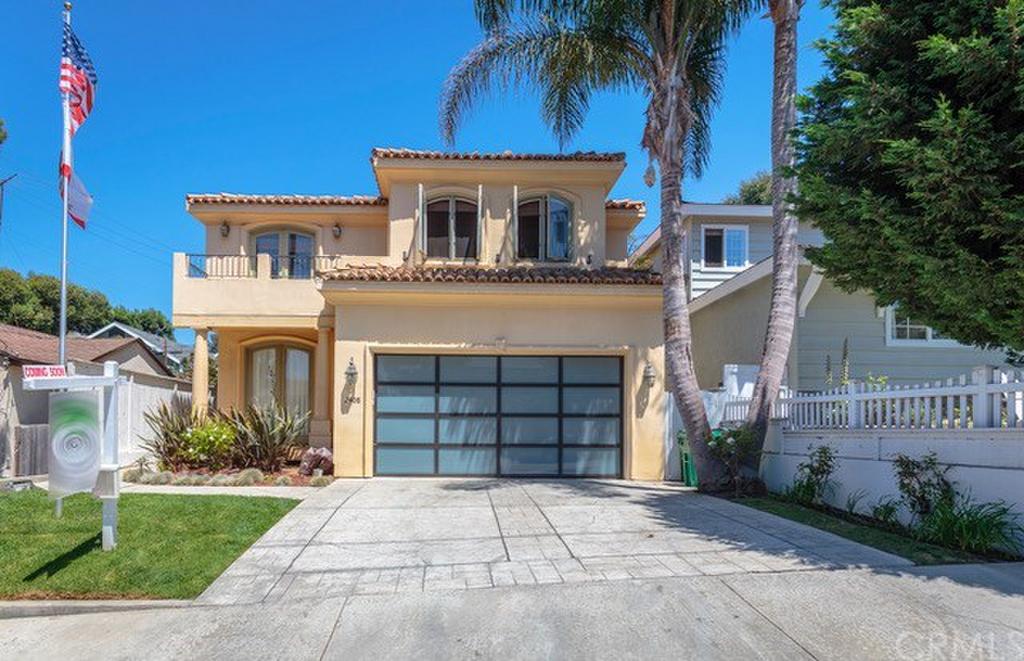 But just after 2009 Elm closes in the 2.2's, a custom/unusual Mediterranean from 1999 at 2408 Pine (4br/3ba, 3175 sqft.) sold, too. 2408 Pine had tried to price to market out of the blocks ($2.299M), but needed 112 DOM to draw an offer, and now has closed even lower at $2.200M.
Yet another late-90s Mediterranean at 1408 Walnut went into escrow (for a second time) late in the year, last at $2.395M.
Were all these late-2017 sales in the Tree Section examples of holiday-season bargain-hunting, or indicators of a drop in overall values? We won't know till 2018 shows its stuff. It does seem that a notable break in pricing pertains to pre-2000 versus post-2000 properties. Take note.
We'll have more data on the year that was throughout January.
Here's the rest of our local real estate market update report for the period ending 12/31/17:
- 41 active listings as of 12/31/17 (-21)
- 36 SFRs (-16)
- 5 THs (-5)
See the inventory list as of 12/31/17 here, or see the MB Dashboard for up-to-the-minute data.
Active listings by region of Manhattan Beach in this report:
- Tree Section: 14 actives (+1)
- Sand Section: 19 actives (-11)
- Hill Section: 2 actives (-4)
- East MB: 6 actives (-7)
We're also providing a report on closed sales by region of MB.
Sales data, including PPSF for all properties, are organized by sub-region of Manhattan Beach.
Here's a link to the spreadsheet: "MB Pending/Sold as of 12/31/17."
Please see our blog disclaimer.
Listings presented above are supplied via the MLS and are brokered by a variety of agents and firms, not Dave Fratello or Edge Real Estate Agency, unless so stated with the listing. Images and links to properties above lead to a full MLS display of information, including home details, lot size, all photos, and listing broker and agent information and contact information.


