It took a while for MB median prices to start to track what seemed to be happening in the market.
No more.
Take a look at our newest compilations of data as of the midpoint of this year.
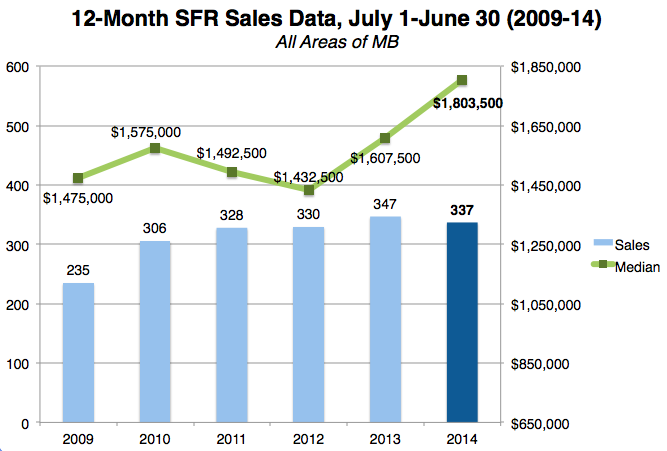
 Citywide, the median price for single-family homes (SFRs) is $1.803M, up 12% year-over-year. That's a quick, cool $200K…
It took a while for MB median prices to start to track what seemed to be happening in the market.
No more.
Take a look at our newest compilations of data as of the midpoint of this year.
 Citywide, the median price for single-family homes (SFRs) is $1.803M, up 12% year-over-year. That's a quick, cool $200K bump in no time at all. (Please note: We have excluded townhomes traditionally from our median price calculations for a few reasons; now, to compare year to year data, we continue to focus only on SFR data.)
Look at that trendline. It's a rocket to the moon.
There was an anomalous dip in the 2012 median to $1.432M, even as the market was recovering solidly at the time. From there, it's two years of big climbs – a 26% jump in only 24 months.
Word to the wise: Don't try to run uphill like that for too long.
 While it seems we've had about the same-to-higher inventory over the past year or so, the sales totals coming in are mostly lower in each of the 4 charts we'll show you, basically even, but a tick lower.
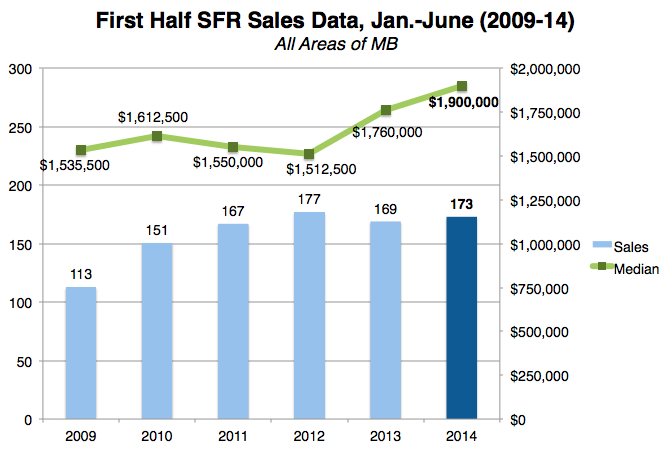
Only on the 6-month scale for SFRs citywide do we see a modest tick up in the sales total to 173 (versus 169 last year).
Really the figures for each of the past 4 years look pretty much the same – on the bottom, where we report sales totals. The prices... not so similar.
(It's true that we could see a few more pre-June-30 sales post to the MLS soon, which might cause some tweaks to a "final" report of this data.)
We'll note that the 6-month median price for all MB SFRs is substantially higher than the 12-month figure at $1.900M. This reflects fewer sales, and is more variable, but also more "of the moment." It's worth noting that the 6-month figures for each year are higher to begin with. The jump year-over-year here is just 8% instead of the 12% on the 12-month scale.
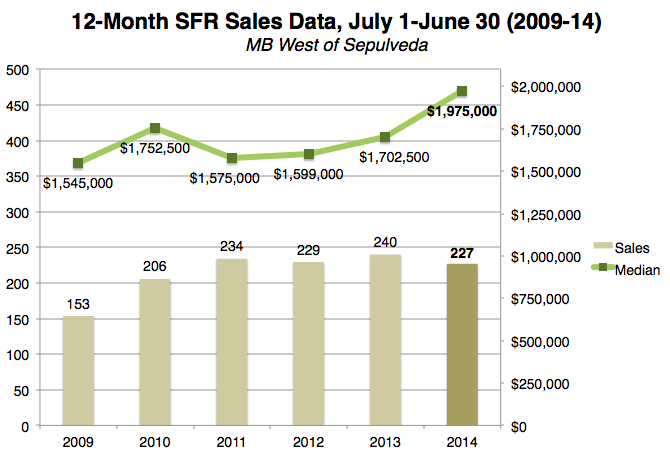
 Going west of the highway only, we see similar trends and some fairly shocking numbers.
There were fewer sales by a bit, with 227 total sales versus 240 last year on the 12-month scale.
But it looks like last year's $1.702M median price was just the beginning.
We're now at $1.975M, a jump of $273K and 16% year-over-year by this broadest-scale measure.
That is another hill you'd rather not run up.
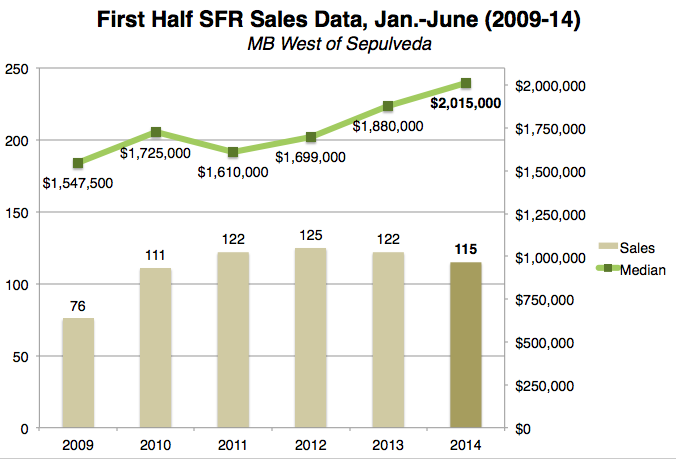
 On the 6-month scale, where the sample size gets smaller and less reliable, we still see something amazing to report: A median price over $2.0M.
To be precise, $2.015M.
As with the citywide figures, you have higher numbers each year looking only at the first half's sales data. So the jump to $2.0+ was not as high – "only" +7% year-over-year instead of the 16% using a full year's worth of sales.
Still, these half-year data have tended to suggest what's next.
And what is next, MB?
The factors fueling these enormous price jumps in a short period of time don't seem to be moderating: Low rates, low inventory, high demand.
People talk about how it would be nice to see this market "level off." Seems like that would be best for everyone.
But watch those trendlines. There may be quite a bit more left in this rally.
Please see our blog disclaimer.
Listings presented above are supplied via the MLS and are brokered by a variety of agents and firms, not Dave Fratello or Edge Real Estate Agency, unless so stated with the listing. Images and links to properties above lead to a full MLS display of information, including home details, lot size, all photos, and listing broker and agent information and contact information.

 Citywide, the median price for single-family homes (SFRs) is $1.803M, up 12% year-over-year. That's a quick, cool $200K…
 While it seems we've had about the same-to-higher inventory over the past year or so, the sales totals coming in are mostly lower in each of the 4 charts we'll show you, basically even, but a tick lower.
 Going west of the highway only, we see similar trends and some fairly shocking numbers.
 On the 6-month scale, where the sample size gets smaller and less reliable, we still see something amazing to report: A median price over $2.0M.