The COVID-19 pandemic ruined a lot of lives and business in 2020, but, oddly, made for one of the best years in Manhattan Beach real estate ever.
Chalk it up to whatever mix of factors you favor:
- Ultra-low mortgage rates resulting from economic stimulus
- Inherent appeal of Manhattan Beach
- Second home/vacation home buyers
- Home school/home office needs inspiring life/house changes
- Disparate impacts of the pandemic by wealth/class
The year saw both a 10% increase in the total number of sales and a 10% increase in the median price for Manhattan Beach homes.
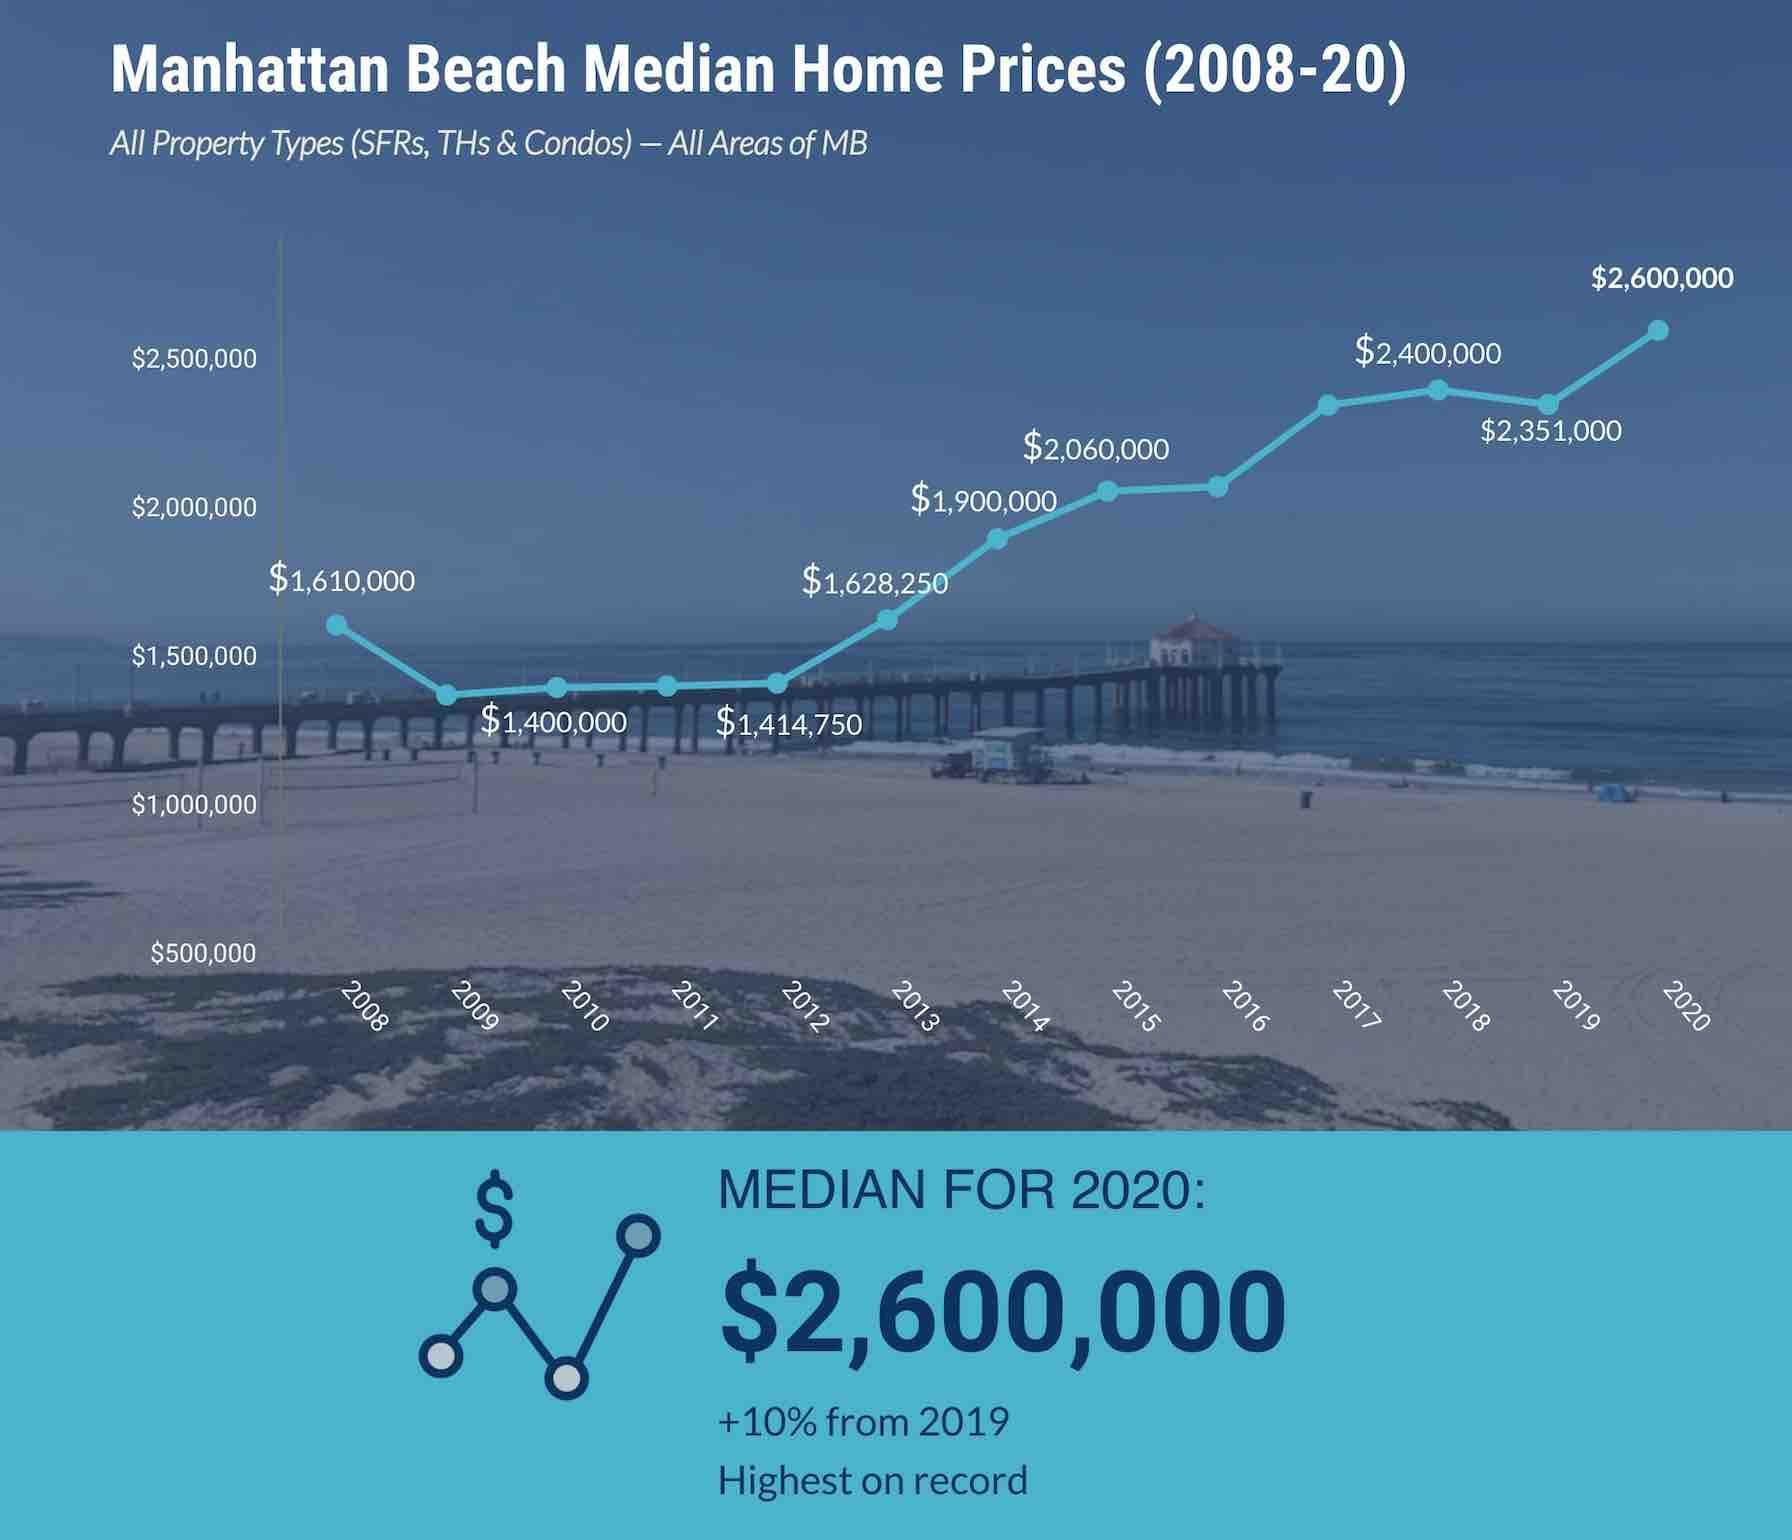
The median price for Manhattan Beach homes reached $2.600M for the first time ever.
That jump of 10% over the end-of-2019 figure was quite a reversal, also.
The 2019 median price of $2.351M actually represented the first (modest) downturn in the local median price since 2009. It was a slight 2% correction that hinted that maybe the oft-rumored "end" of our upcycle was here. (It was not.)
The median only broke $2.000M in 2015, a time that's recent enough to kinda remember. Now we're more than halfway to $3.000M.
 The number of sales for 2020 is its own kind of astonishing story.
First, we'll just note that 430 sales within the calendar year was only topped once in the prior 12 years, in 2012 at 450 sales. (The rally had just begun then.)
You can count on something around 400 home sales per year within Manhattan Beach. But as the market dried up for a couple of months during the (first) stay-at-home period in the Spring, the annualized sales pace dipped to the low 300s.
As we've reported at length with each amazing run of data, the post-Spring rebound in sales made Summer/Fall 2020 the hottest period for local real estate we can see in the data. And the burst of activity more than made up for "missing" months, crowning 2020 as the second-highest-volume year for local home sales.
It's worth noting that the year ended with a higher inventory overhang than normal, with 79 listings active when the ball dropped in NYC. (Sidebar: If a ball drops and no one is there to watch it, does the new year, in fact begin? Yes!)
Those 79 listings were the most properties on market at year-end since our comparable data begins in 2013. The high previously had been 70 listings at the end of 2016. Near that level, 2018 ended with 69. And 2019 ended with 60 listings on the market.
Ordinarily, higher inventory would be a sign of a slowing market, but year-end numbers are a bit harder to gauge, and 2020 had enough weirdness and non-seasonality that we're unable to call this figure an indicator of anything.
There is more and more to say. We'll share some more 2020 data soon.
Here's the rest of our local real estate market update report for the period ending 12/31/20:
> 79 active listings as of 12/31/20 (-10 from 12/15/20)
> 54 SFRs (-8)
> 25 THs (-2)
See the Inventory list as of 12/31/20 here, or see the MB Dashboard for up-to-the-minute data.
Active listings by region of Manhattan Beach in this report:
> Tree Section: 12 actives (flat)
> Sand Section: 40 actives (-8)
> Hill Section: 5 actives (-1)
> East MB: 22 (-1)
We're also providing a report on closed sales by region of MB.
Sales data, including PPSF for all properties, are organized by sub-region of Manhattan Beach.
Here's a link to the spreadsheet: "MB Pending/Sold as of 12/31/20".


