The market was moving so fast, with so little inventory, back in February this year, that we saw a recent record low for "months of supply." (See our post from then, "Months of Supply Craters at 15-Year Low.")
The measure "months of supply" takes into account the pace and number of homes going into escrow, and…
The market was moving so fast, with so little inventory, back in February this year, that we saw a recent record low for "months of supply." (See our post from then, "Months of Supply Craters at 15-Year Low.")
The measure "months of supply" takes into account the pace and number of homes going into escrow, and estimates how long it would take to sell every listing on the market.
 Now, with a slight drop in the pace of new deals, and a gentle increase in inventory, we're seeing the arc reverse, and "months of supply" increasing.
It's all relative, though, as we'll show.
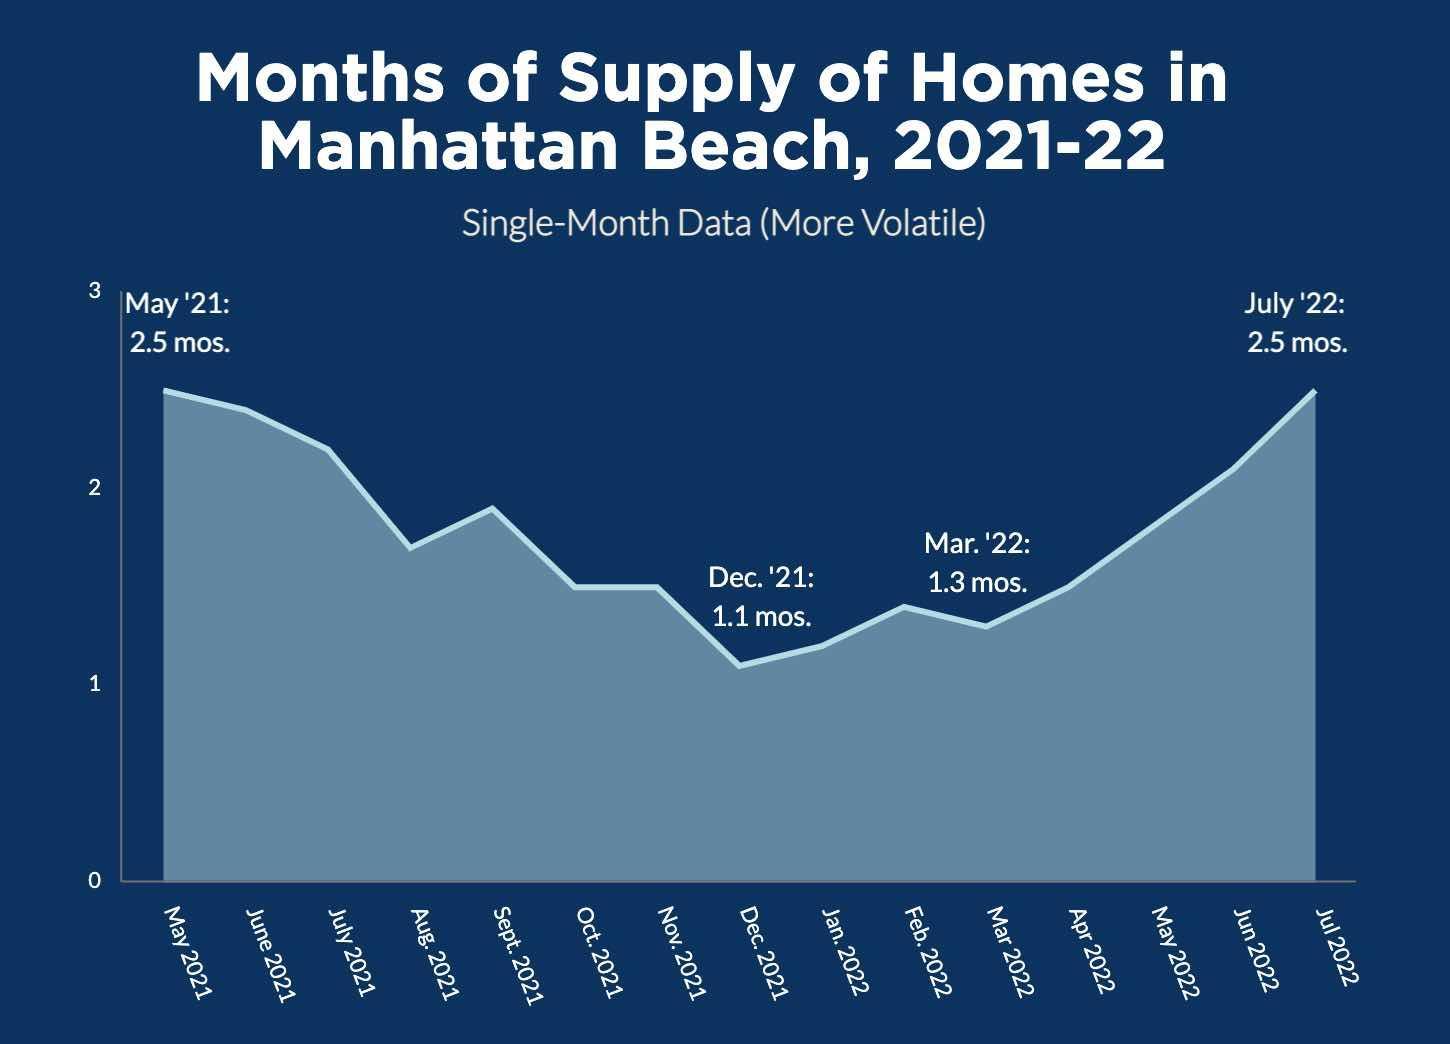
Our first chart here shows you a month-by-month snapshot of the data over 14 months, as the supply figure dipped to near-nothing at year-end 2021, then ran up through the end of July 2022.
Basically you are seeing the city's months of supply returning now to Spring 2021 levels.
Take a step back now to see these data in context.
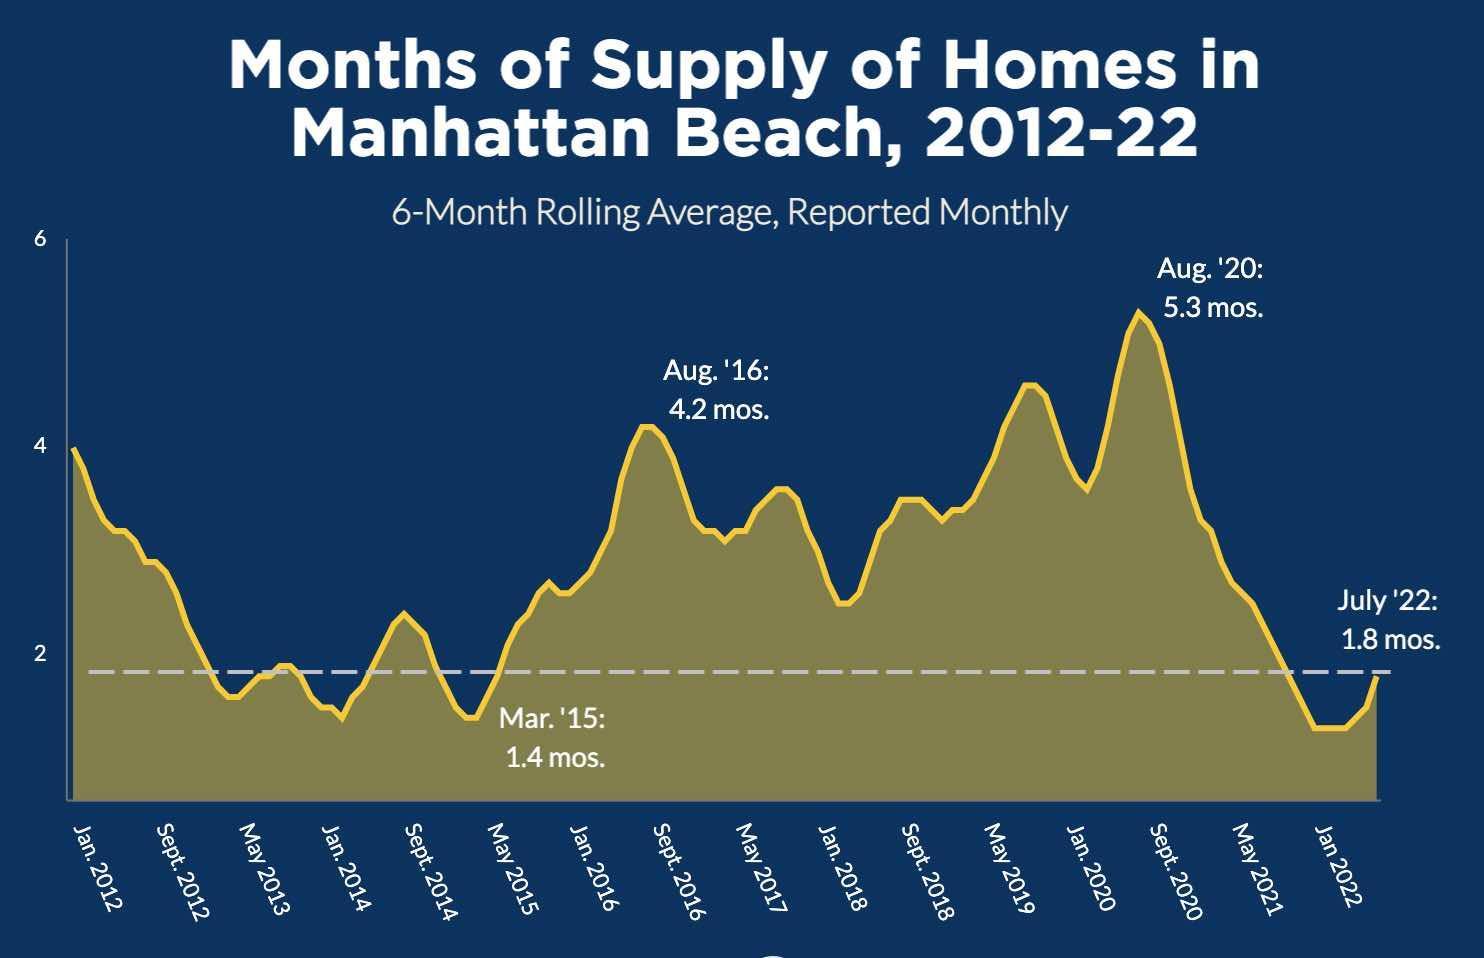 Typically we smooth out the data by using a 6-month rolling average, instead of one-month data. So we've changed that in this chart.
And we're showing 10 full years plus 2022's data year-to-date.
The picture's different, isn't it?
The trend may be up, but the actual level for months of supply remains at a point so low it was only seen in the Spring selling season early in this cycle, 2013-15, before rising later in each of those years.
So we are still way, way below typical levels.
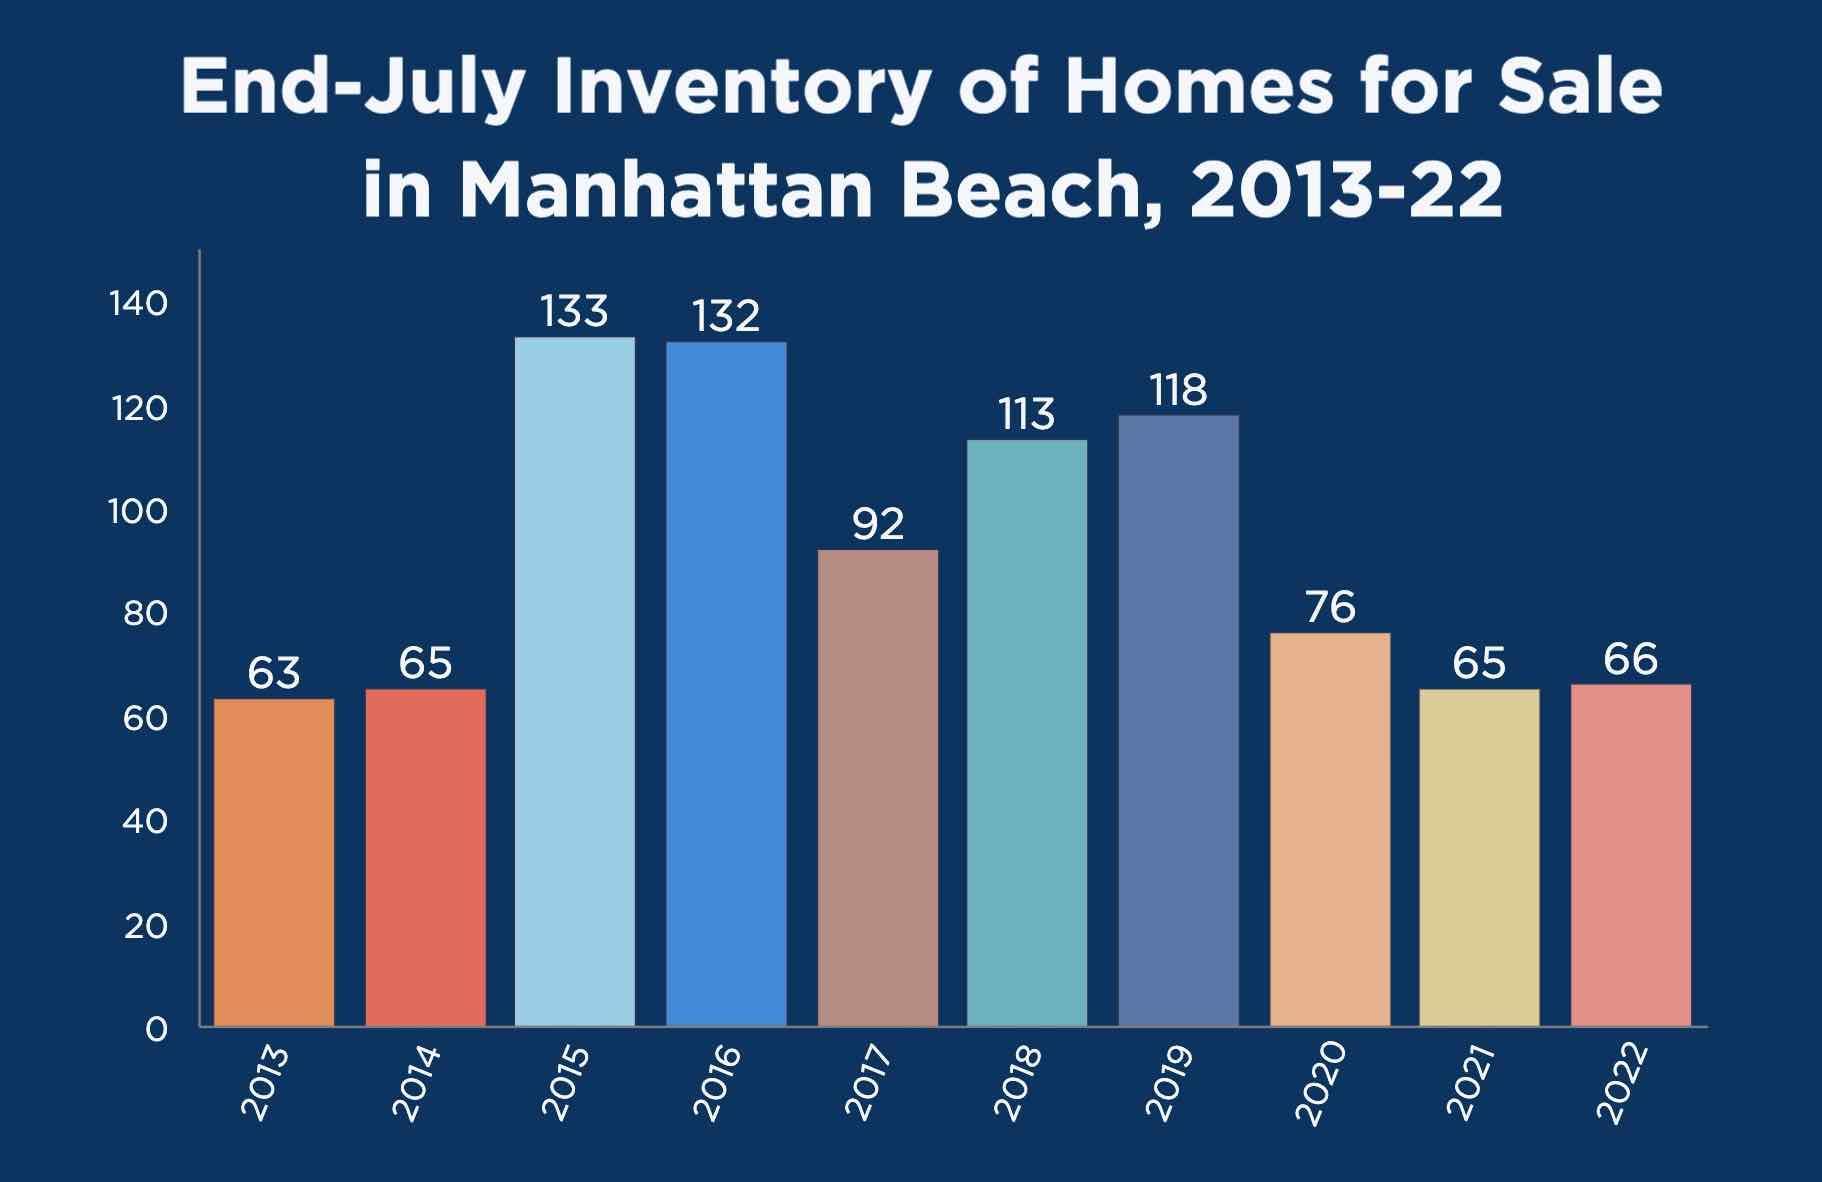 We have spoken a lot about inventory this year, as its lag has often posed problems in the market. Here's where inventory as of July 31 stood against recent years.
Right away, you can see we're at about the same levels as 2020 and 2021, as well as way back in hot-too-hot 2013-14.
But there were 5 years in the middle there near, or well over, 100 listings in Summer.
That period's inventory level is what we've more or less internalized as "normal," and why today's figure still seems low. (The pandemic has played havoc with the local real estate market and expectations of "normal," as you know.)
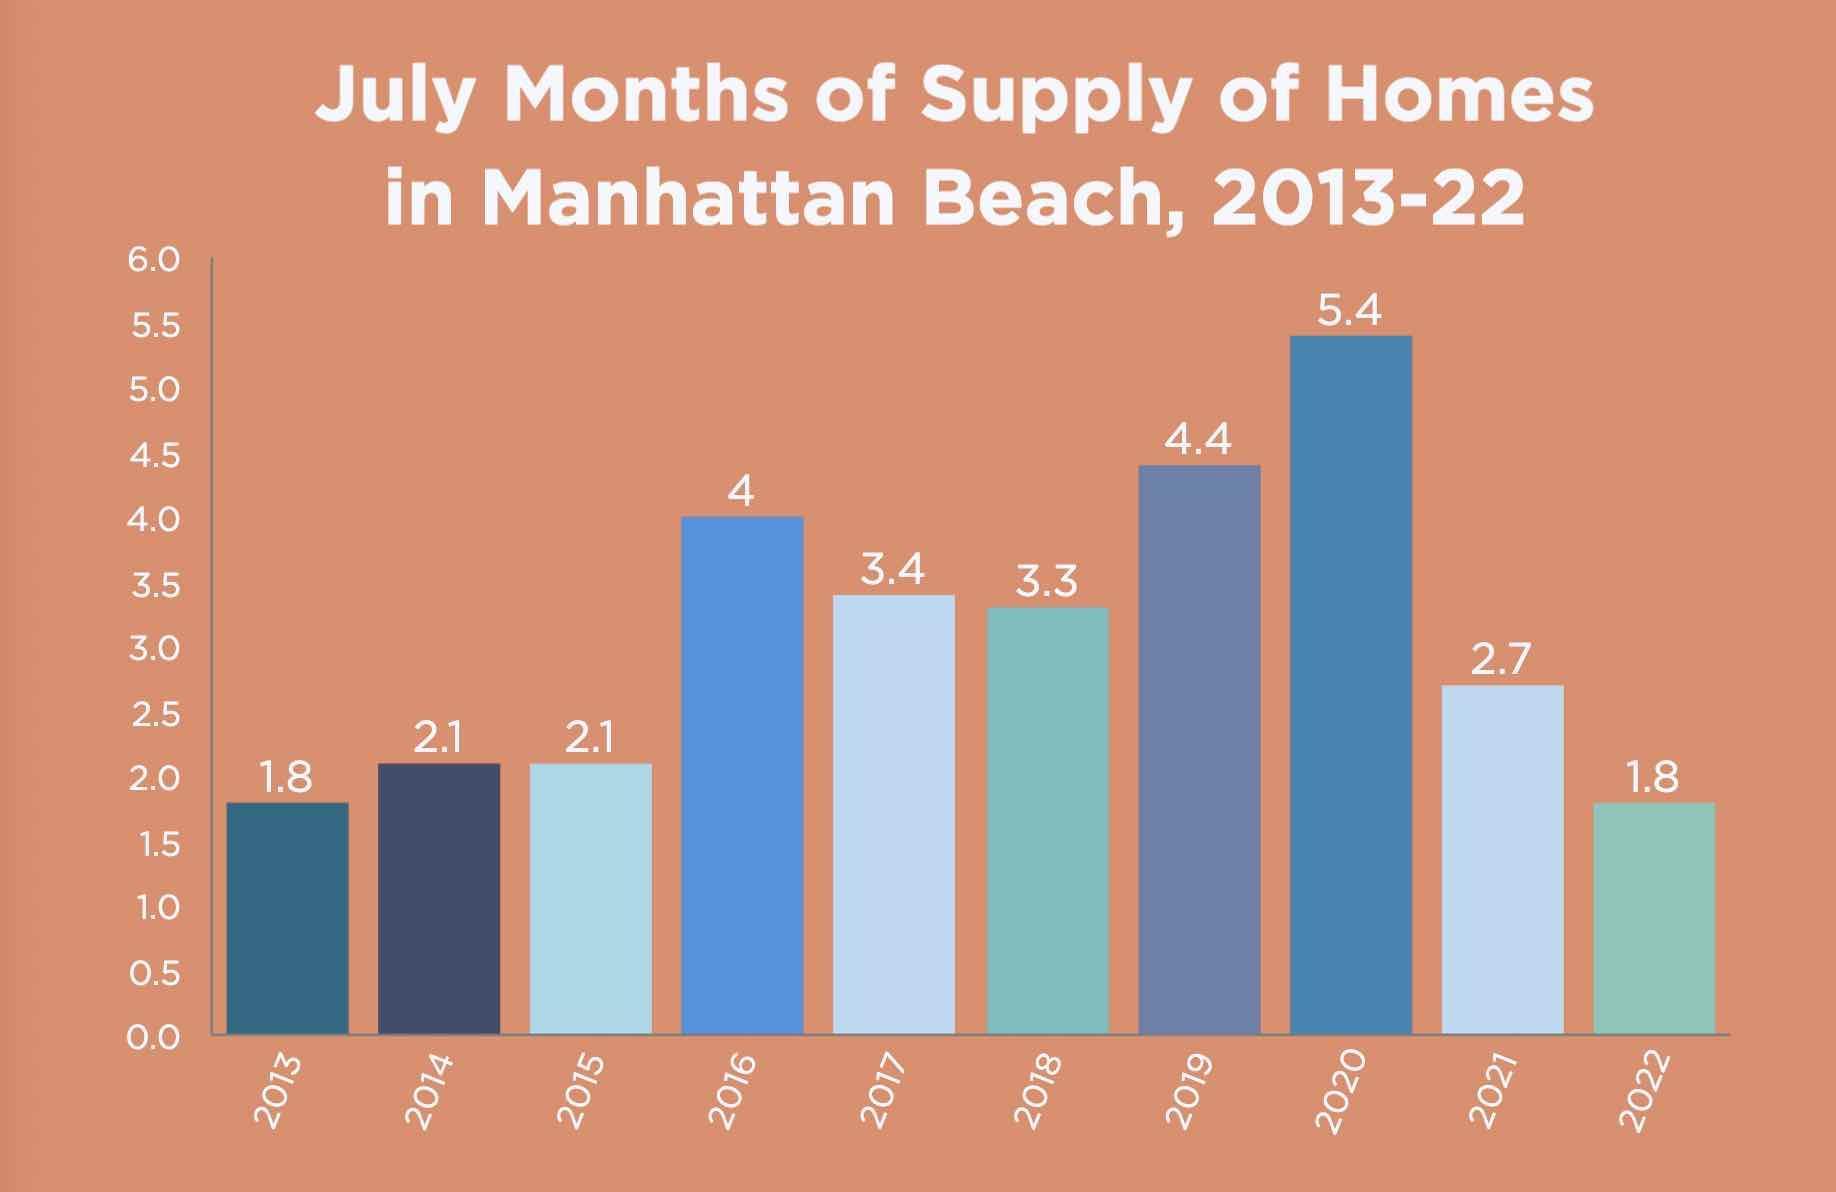 Here's one more chart, more or less merging the other presentations above. Here, we've isolated the end-of-July months-of-supply figure for the same period of time as we just showed inventory, 2013-22.
This is a way of showing what typical months of supply might be around this time of year. Once again, this underscores how we're still quite low now.
(That peak in 2020 is worth a comment. Despite the frenzy of home trading in July 2020, and the modest inventory level then, "months of supply" remained very high because of the 6-month averaging, which included months where the market was all but shut down.)
When you look at far bigger data sets than Manhattan Beach, such as California as a whole, or national data, months of supply right now is closer to 2.5 months.
The old-fashioned rule of thumb was that 6 months of supply signified a buyers' market, but it's more accepted today that 4 months of supply can mean a buyers' market, due to how the internet has sped the home search process and other aspects of real estate.
Hot tip: We're not getting anywhere near 4 months of supply here in MB unless we get a real influx of inventory for September/October's market.
------------------------------------
Nerdy notes:
Inventory data are compiled as part of MB Confidential's twice-monthly MB Market updates.
Months of supply data comes from the California Regional Multiple Listing Service, Inc., InfoSparks © 2022 ShowingTime.
Please see our blog disclaimer.
Listings presented above are supplied via the MLS and are brokered by a variety of agents and firms, not Dave Fratello or Edge Real Estate Agency, unless so stated with the listing. Images and links to properties above lead to a full MLS display of information, including home details, lot size, all photos, and listing broker and agent information and contact information.


