As we noted first last week, the sales data for our little hamlet from the first half of 2012 don't exactly tell the story we expected.
 Median prices down?
 Even with the mini-frenzy that has erupted over some listings this year?
Yes and no.
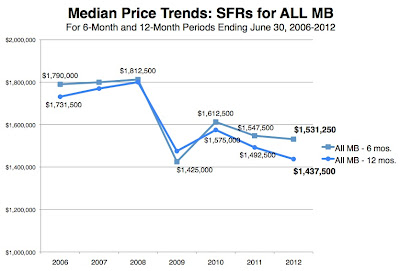
Citywide, the median price for SFRs is down by any measure.
(See our first…
As we
noted first last week, the sales data for our little hamlet from the first half of 2012 don't exactly tell the story we expected.
Median prices down? Even with the mini-frenzy that has erupted over some listings this year?
Yes and no.
Citywide, the median price for SFRs is down by any measure.
(See our first chart here; click to enlarge.)That's true whether you look at the 6-month or 12-month periods ending June 30, 2012.
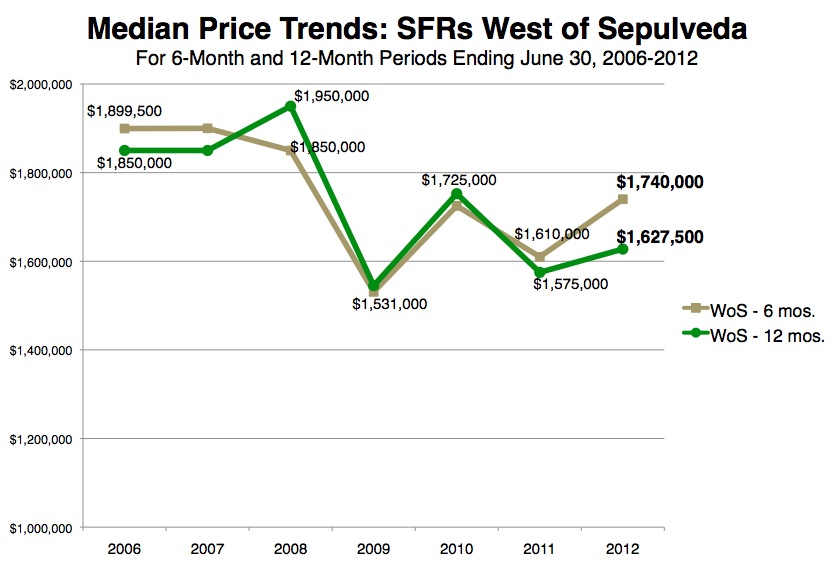
But West of Sepulveda, the median price is up. Again, by either measure.
The deeper you get into these data, the more you see that there's something for everyone.
You can prove prices are up by a little or (nearly) a lot. Or you can prove that prices are down. You can prove that West of Sepulveda is performing much better than MB as a whole, with a median price nearly $200k higher than the citywide figure. It's all there.
We ran the data in 2 separate ways:
- Comparing the 6-month periods ending June 30 of each year, 2006-2012, and
- Comparing the 12-month periods ending June 30 of each year, 2006-2012.
The larger data sets show lower
current median prices, hinting that a jump in prices is more pronounced recently.
As we've seen before, the smaller the dataset, the narrower the window of time, the more volatile the numbers. So we tend to see the smaller 6-month numbers as less reliable – but time will tell.
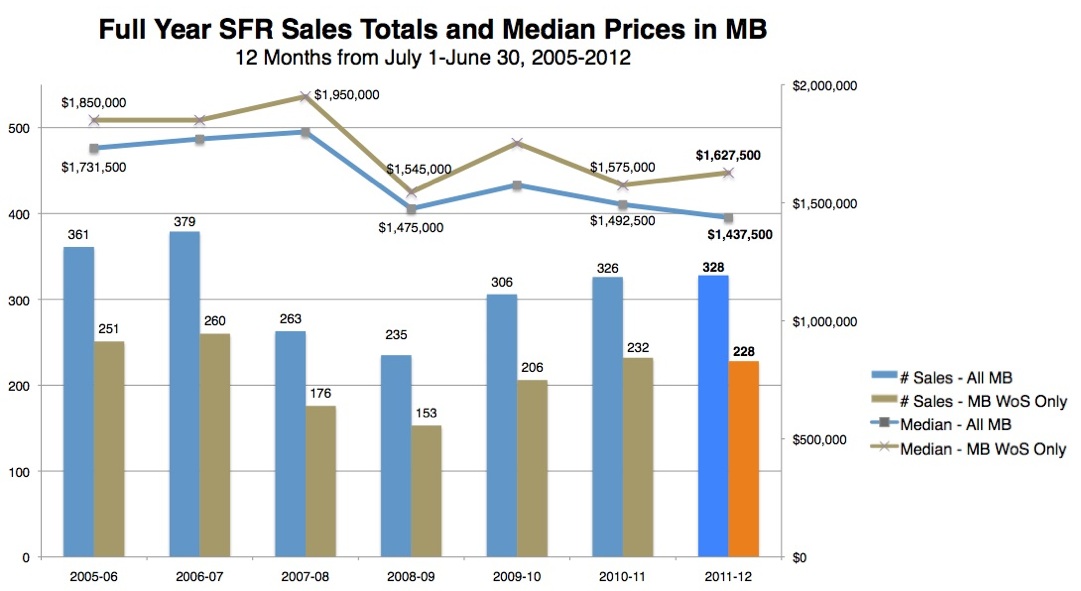
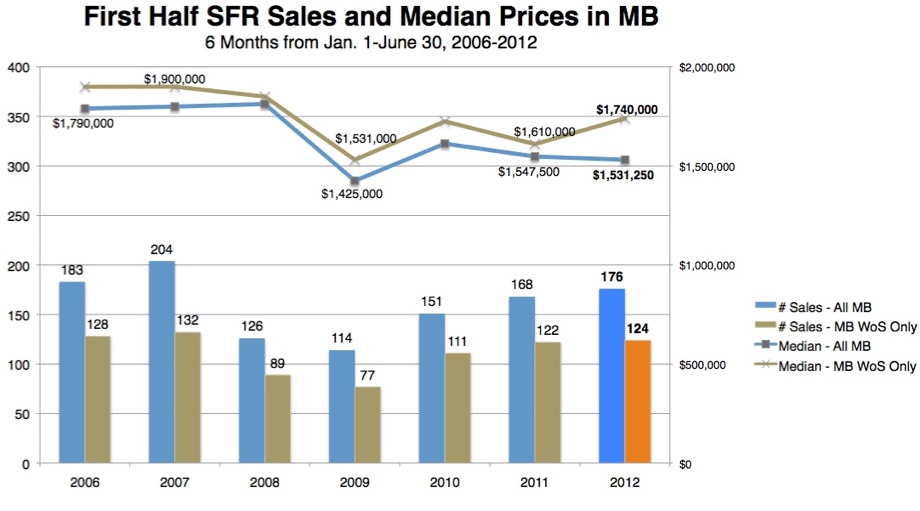
We tried putting all of these data into charts, and saw that the results were confusing. Last week's single chart for the 6-month data gave you sales totals
plus median prices for
2 regions of MB over 7 years.
It was a great chart if you're a nerd trying to learn something, but frankly not very accessible.
So we narrowed the data.
You see the citywide median prices above. Here's the run of median prices for west of Sepulveda (6-month and 12-month sets).
It's quite striking to see the upward trends for this region regardless of time period. The city's down, but west of the highway is up. Something is different near the beach.
Last year, $1.575m by the 12-month measure; this year, $1.627m – a boost of 3%.
Last year, $1.610m for a 6-month period; this year, $1.740m, or plus 8%.
And if you're game, check out our last charts, the compleat 12-month data on sales figures and median prices for both regions (noodle away!) and a re-post of the same chart from last week with just 6-month data.
(Click any chart to enlarge.)
Please see our blog disclaimer.
Listings presented above are supplied via the MLS and are brokered by a variety of agents and firms, not Dave Fratello or Edge Real Estate Agency, unless so stated with the listing. Images and links to properties above lead to a full MLS display of information, including home details, lot size, all photos, and listing broker and agent information and contact information.
Based on information from California Regional Multiple Listing Service, Inc. as of July 27th, 2024 at 2:25am PDT. This information is for your personal, non-commercial use and may not be used for any purpose other than to identify prospective properties you may be interested in purchasing. Display of MLS data is usually deemed reliable but is NOT guaranteed accurate by the MLS. Buyers are responsible for verifying the accuracy of all information and should investigate the data themselves or retain appropriate professionals. Information from sources other than the Listing Agent may have been included in the MLS data. Unless otherwise specified in writing, Broker/Agent has not and will not verify any information obtained from other sources. The Broker/Agent providing the information contained herein may or may not have been the Listing and/or Selling Agent.