
The local paper of record thought it was big news Tuesday, so they put a front page, "above the fold" headline on a story to catch readers' attention.
"Home sellers are cutting prices," was the headline in the LA Times. The story mixed analytical data and anecdotes from local real estate brokers, saying that more listings are taking price cuts than have been seen in recent years. (See the article here [paywalled]).
We saw that and thought, hmmm.
It might be media hype, it might be premature forecasting, or it might even be the first hints of a truly changing local real estate market.
Because, sure, it would be true, if listings were generally hanging around more, and sellers had to cut to attract buyers, that we could be witnessing an early sign of a market shift.
But there's no story if the data aren't there, right? The theme of the LA Times story was that "more" price cuts are happening now than before.
Is it really happening?
And is it happening in Manhattan Beach?
 Data points from the Times (bullets added):
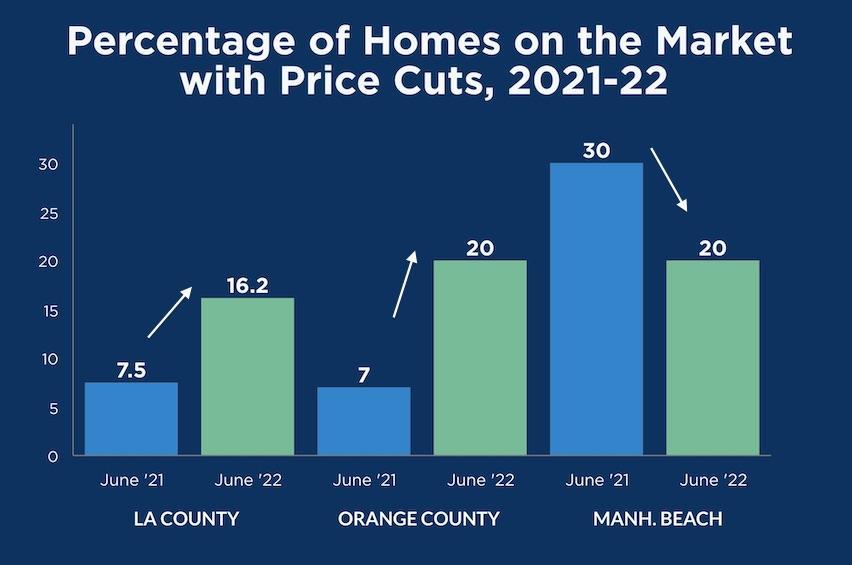
* "The share of homes listed for sale that took recent price cuts has more than doubled since last year."
* "During the four weeks that ended June 5, 16.2% of listings in L.A. County had at least one price cut, up from 7.5% during the same period last year, Redfin data show."
* "In Orange, Riverside and San Bernardino counties the share of price drops rose to more than 20% of listings, up from about 7% a year earlier."
To be clear, this first bit of data is comparing to the most white-hot year in recent history, 2021. We'll call this a yellow flag. It's not wrong to do a year-over-year comparison, but a calming of the market was also practically guaranteed, or at least to be expected.
Still, 2-3x the number of price cuts, that's something.
Now, is that happening in Manhattan Beach?
Not really.
 In 2021, at this exact time of year, there were 63 homes on the market, 19 of which had price cuts. That was 30% of the active inventory sitting with a price cut.
In 2022, as of Tuesday, there were 55 homes on the market, 11 of which had price cuts, or 20% of the market.
So, neither are there more total homes on the market with price cuts now, nor is the share of inventory with price cuts today greater than last year. (White-hot 2021!)
Right now, our local market is "healthier" by this measure, year-over-year.
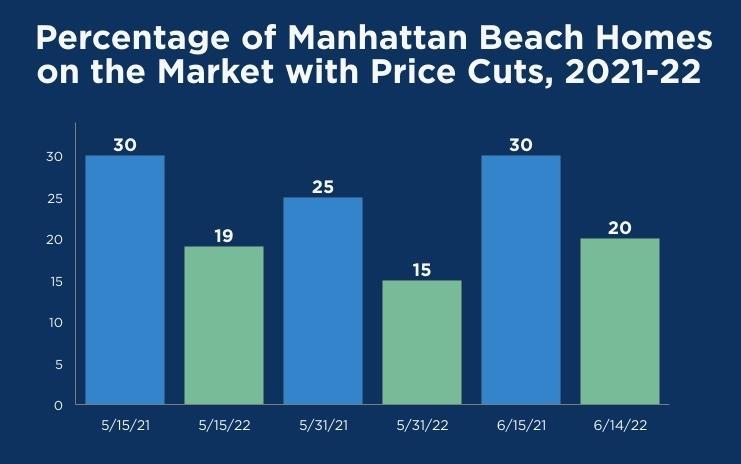 Indeed, we went back and checked on 2 more recent springtime periods, looking at market data for our MB Market Updates as of May 15 & May 31, also.
Same story as you compare other parts of Spring 2022 with last year. There were both fewer homes on the market this year with cuts, and a lower percentage of active inventory with price cuts.
You might note that our current 20% of inventory with cuts is higher than the Redfin-reported rolling average for LA County (16.2%). Still, the local trend is the opposite of what those data show for the county. And the Times was presenting a trend story.
We thought to try to share a comparison to a pre-pandemic year with you. We began by checking on mid-June 2019.
Guys, there were 136 listings on the market then! Compared to our 55 now. Does it even matter how many had cuts?
Now, this is not to say that a change in the market isn't coming, can't happen, or even that a change is not under way. We're just saying that local data don't match up to what the Times reported today about SoCal.
Perhaps, as is often the case, Manhattan Beach will lag negative trends that start elsewhere.
Going Macro: National Data from Redfin
The Times noted that they were looking at SoCal numbers produced by Redfin.
We dug and found a Redfin post from early June, summarizing many indicators nationally, and it was gloomy.
The Redfin post memorably begins, "May marked a turning point in the pandemic housing frenzy, as buyers regained some control over the market."
Ooooh, they called it!
While hinting at a shift toward a buyer's market, Redfin also has just slashed 8% of its workforce, citing a drop in demand "17% below expectations."
Maybe that's putting your money where your mouth is?
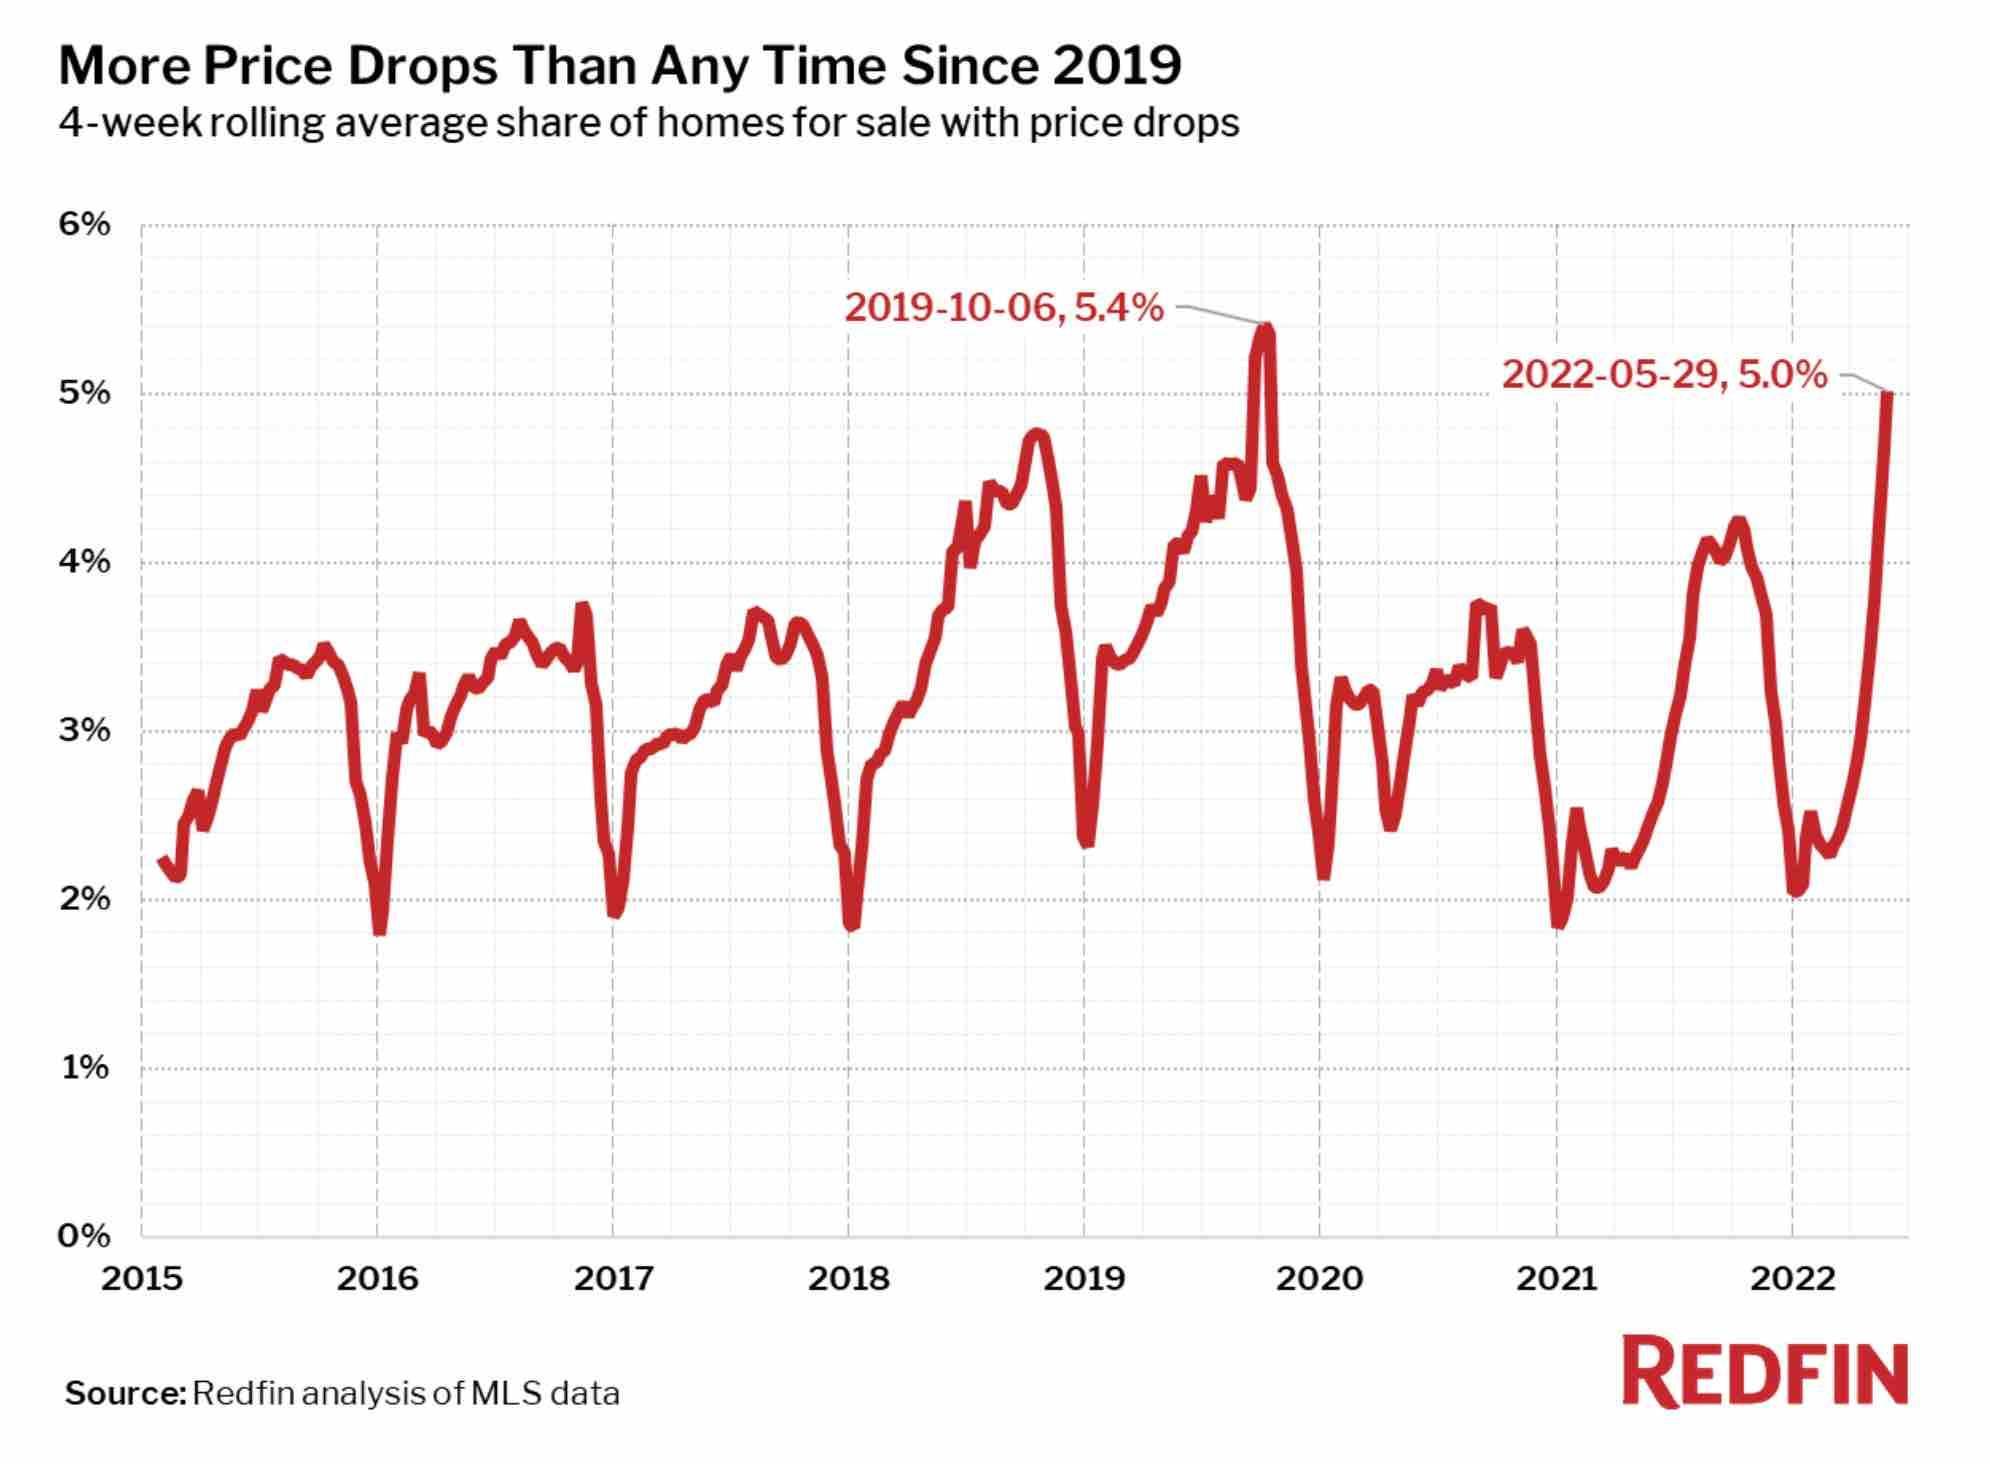 Back to that data post, though. Redfin had this chart showing the number of homes with price cuts.
This data aggregates 400+ metro areas across the United States.
The chart points to 5.0% of listed homes having price cuts. (Using a 4-week rolling average.) We're not sure why the percentage is consistently so low (remember, MB is at 20%), but for now, let's just compare this data within the four corners of its own chart.
If you discern the May 2021 to May 2022 points, it does appear that this year is about double the rate of last year. (Although, as noted, last year was very hot.) Indeed, the 5/29/22 data point is substantially higher than at the same time for any other year in their 8-year chart.
It's also worth noting that there are no periods with a much higher share of homes with reductions than about now (5.0%), besides a peak in Fall 2019 at 5.4%. And late 2019 was a time when median price trends headed down.
So, just looking at this dataset that purports to analyze the U.S. real estate market at a macro level, this specific set is showing an uptrend in price cuts, and more price cuts than typically have been seen at any time of year.
It won't shock anyone if home price inflation stops, or even mildly reverses. When you gain 25-30% in 2 years, that trend will flatten out. Try running uphill some time.
Still, you'd need a bit more evidence, beyond some price cuts, to really say that there's a shift under way... inventory increasing, DOM increasing, homes closing under asking price.
We'll watch for it, in the LA Times, on Redfin and here in MB.


