The first half of the year brings the busy Spring Selling Season, a hint of how the rest of the year may go.
This year, some Spring Selling was very necessary, because the first quarter was dreadful and maybe best left unmentioned.
So where do we stand now, halfway through 2009?

According to MLS data on closed sales…
The first half of the year brings the busy Spring Selling Season, a hint of how the rest of the year may go.
This year, some Spring Selling was very necessary, because the first quarter was dreadful and maybe best left unmentioned.
So where do we stand now, halfway through 2009?
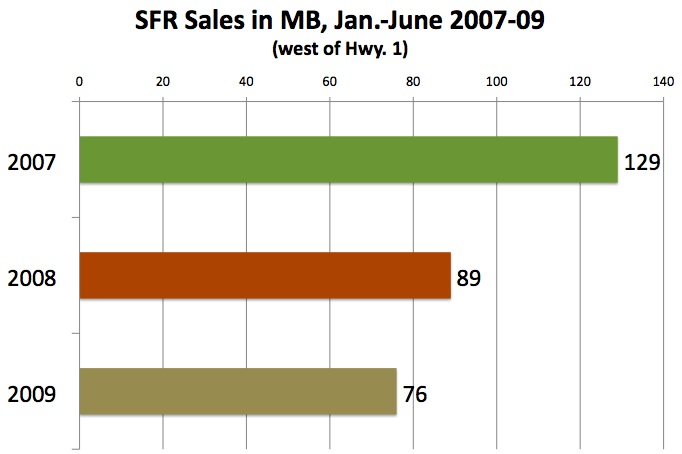
According to MLS data on closed sales by month, the sales pace for January-June in MBC's principal coverage area, west of Sepulveda, remains below the past 2 years for the same period.
(Click chart to enlarge.)Regular readers will recall that 2007, which right here looks like a good year, comparatively, actually wound up with the slowest sales pace in MB in 20 years. (See, for instance, "
Beach Sales: South Since '02-'03," and "
Turns Out '08 Got Worse.") We just keep beating the record.
For the first half of 2009, the sales pace is off
41% from 2007. (From 129 closed sales to 76.) That comparison may overstate how badly 2009 will fare overall, because 2007 had a major Spring Rally and a big dropoff at year end when The Troubles began.
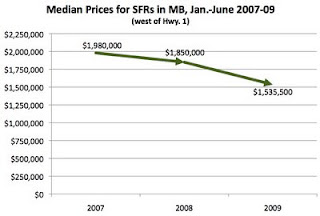
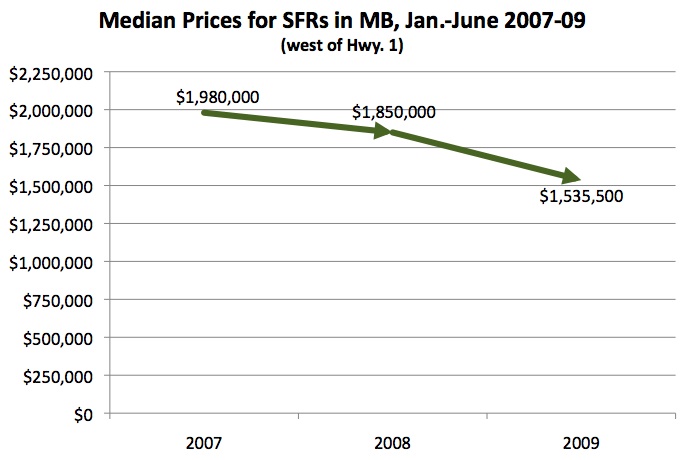
Higher inventory, slower sales – that's supposed to translate to lower prices, and it has.
Data for first-half SFR sales west of Sepulveda show a median-price drop from
$1.980m to
$1.535m, a drop of $445k and
22.4%. (We're not claiming here that 2007 was the peak, just comparing these 3 years.)
(Click chart to enlarge.)There are two things going on here with the median price drop. First, the same sorts of properties are definitely trading for less money in 2009 than in 2007. Take new construction for example: A standard Tree Section speckie might have fetched $2.1m-$2.4m in 2007, but will go for $1.6m-$1.8m now.
The other change is in the
sales mix. The median price is the midpoint among all sales – half the properties sold went below the median, half went for more. In 2009, the bulk of sales are at the (relatively) lower end, and that pulls the median down as well.
We have some charts on the sales mix that we will share in the next post on this subject.

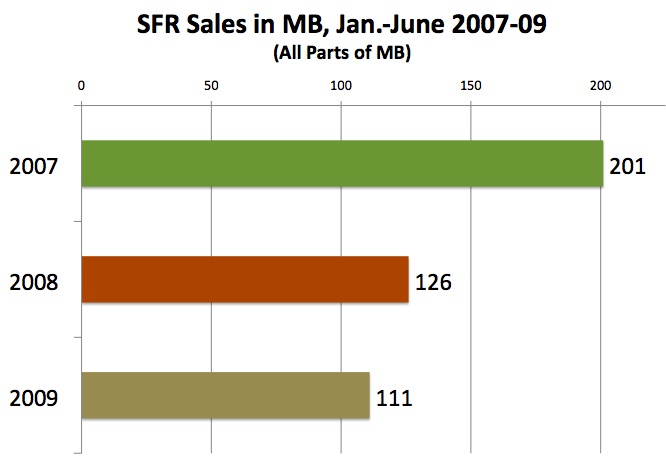
For reference, we also have a chart here on the sales pace for SFRs in all of MB. The drop from 201 to 111 is a slowdown of 45% citywide. So the area west of Sepulveda is doing better by a trifle. That's worth a note for one reason, at least – earlier this year, East MB was said to be doing better, relatively, but any such trend appears to have flattened out.
There will be a few more number-crunching posts here at MBC on this data, but if you don't want to wait for the fancy graphics, some great material is already online at
Kaye Thomas' blog. Kaye had one story about
2nd Qtr. sales 2007-09 which included Jan.-June data, and most recently she posted data on
month-by-month sales from 2000-2009.
MBC has relied on those kinds of posts for some previous stories and we recommend them now while our own graphs and charts take shape at MBC HQ.
Please see our blog disclaimer.
Listings presented above are supplied via the MLS and are brokered by a variety of agents and firms, not Dave Fratello or Edge Real Estate Agency, unless so stated with the listing. Images and links to properties above lead to a full MLS display of information, including home details, lot size, all photos, and listing broker and agent information and contact information.