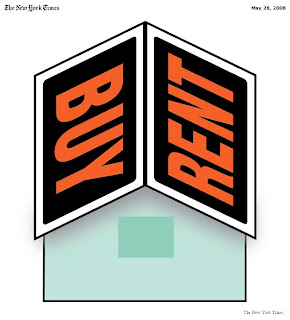
Of all the many people weighing the rent-buy equation, one has the ear of perhaps a million people.
David Leonhardt of the New York Times calls himself "an evangelist for renting," the sort of guy who has tried, repeatedly, to persuade people that the rent-buy equation only favored renting in recent years with…

Of all the many people weighing the rent-buy equation, one has the ear of perhaps a million people.
David Leonhardt of the New York Times calls himself "an evangelist for renting," the sort of guy who has tried, repeatedly, to persuade people that the rent-buy equation only favored renting in recent years with bubble-inflated housing prices. (See, for instance,
this piece from April 2007.)
But Leonhardt is leaving Manhattan (the island, not MB) and moving to the Washington, D.C., area, where he now finds housing more affordable and buying more rational. He's under contract to buy a home. (See the
story of his "conversion" in Wednesday's NYT.)
As Leonhardt explains it, his decision was tied to the "rent ratio" in the area. (Others call this the "price/rent ratio.") To calculate the "rent ratio," you need two comparable homes – one for sale, one for rent. (You need to pick your inputs carefully to get this right, of course.)
Divide the price you'd pay to buy one by the total
annual rent you'd pay to live in the other. That's your "rent ratio."
Here's an illustration using the same MB home for both sides of the equation –
437 1st was recently offered for sale at
$1.650m (it's in escrow). We're told it was also offered for rent at
$7,495/mo. Multiply that monthly rent by 12, and $89,940 is your divisor. The offering price ($1.650m) divided by the annual rent yields a "rent ratio" of
18.3.
So what's "normal?" Leonhardt says that ratios
nationwide stuck between
10-14 for most of the 1970s through the 1990s, then bubbled up to
19 recently. Individual markets vary, and the coasts have higher "normal" ratios.
A chart provided with the story
(use this link to the story, then pull up the national map graphic online) gives the ratio for all of the LA metropolitan area as
24.1 today, and
31.5 at the recent peak. (Also see here for a
Nov. 2007 Fortune/CNN story about the ratios nationwide, and click
here for the accompanying data – select the "P/R" tab at top to the chart.)
Leonhardt says he decided to buy when he saw ratios in Washington of
16 for condos and
15 for SFRs. He still thought that was high, but the excess cost now is worth it to him. (He doesn't discuss prices much, though we're sure that the prospect of buying in D.C. was easier to tackle than buying in Manhattan for a reporter and his wife.)
Now we'll ask readers to calculate some rent ratios of your own. That 1st St. example we offered above may be a poor one, since that monthly rent seemed very high for that home. If the rent is too high, the ratio will be too low.
It's best to use market-rate examples. Please run some examples of active listings (for sale and for rent), and share your inputs and results.
What do you see as the "rent ratio" in MB?If you're not inclined to do the math, you can still use
this cool online tool the NYT is providing. You input rental rates (monthly), a home price and some other standard variables, and you get a custom chart telling you when – if ever – buying works out to be a better deal financially than renting.
Happy calculating...
Please see our blog disclaimer.
Listings presented above are supplied via the MLS and are brokered by a variety of agents and firms, not Dave Fratello or Edge Real Estate Agency, unless so stated with the listing. Images and links to properties above lead to a full MLS display of information, including home details, lot size, all photos, and listing broker and agent information and contact information.

 Of all the many people weighing the rent-buy equation, one has the ear of perhaps a million people.