It's hard to say when Manhattan Beach real estate inventory began to feel permanently cramped. But it seems like supply has been too low for demand since roughly late 2012.
 It's no coincidence that prices have shot up during the same 3-year span, though there are many factors beyond the simple supply/demand…
It's hard to say when Manhattan Beach real estate inventory began to feel permanently cramped. But it seems like supply has been too low for demand since roughly late 2012.
 It's no coincidence that prices have shot up during the same 3-year span, though there are many factors beyond the simple supply/demand imbalance.
Now we see in the data that 2015 is going to close out with the fewest residential real estate sales since 2009-2010.
But if that were bad news, it's not paired with any slippage in the median price for Manhattan Beach properties. Prices are still up.
What does it all mean for the state of the market heading into next year?
First, let's look at sales totals.
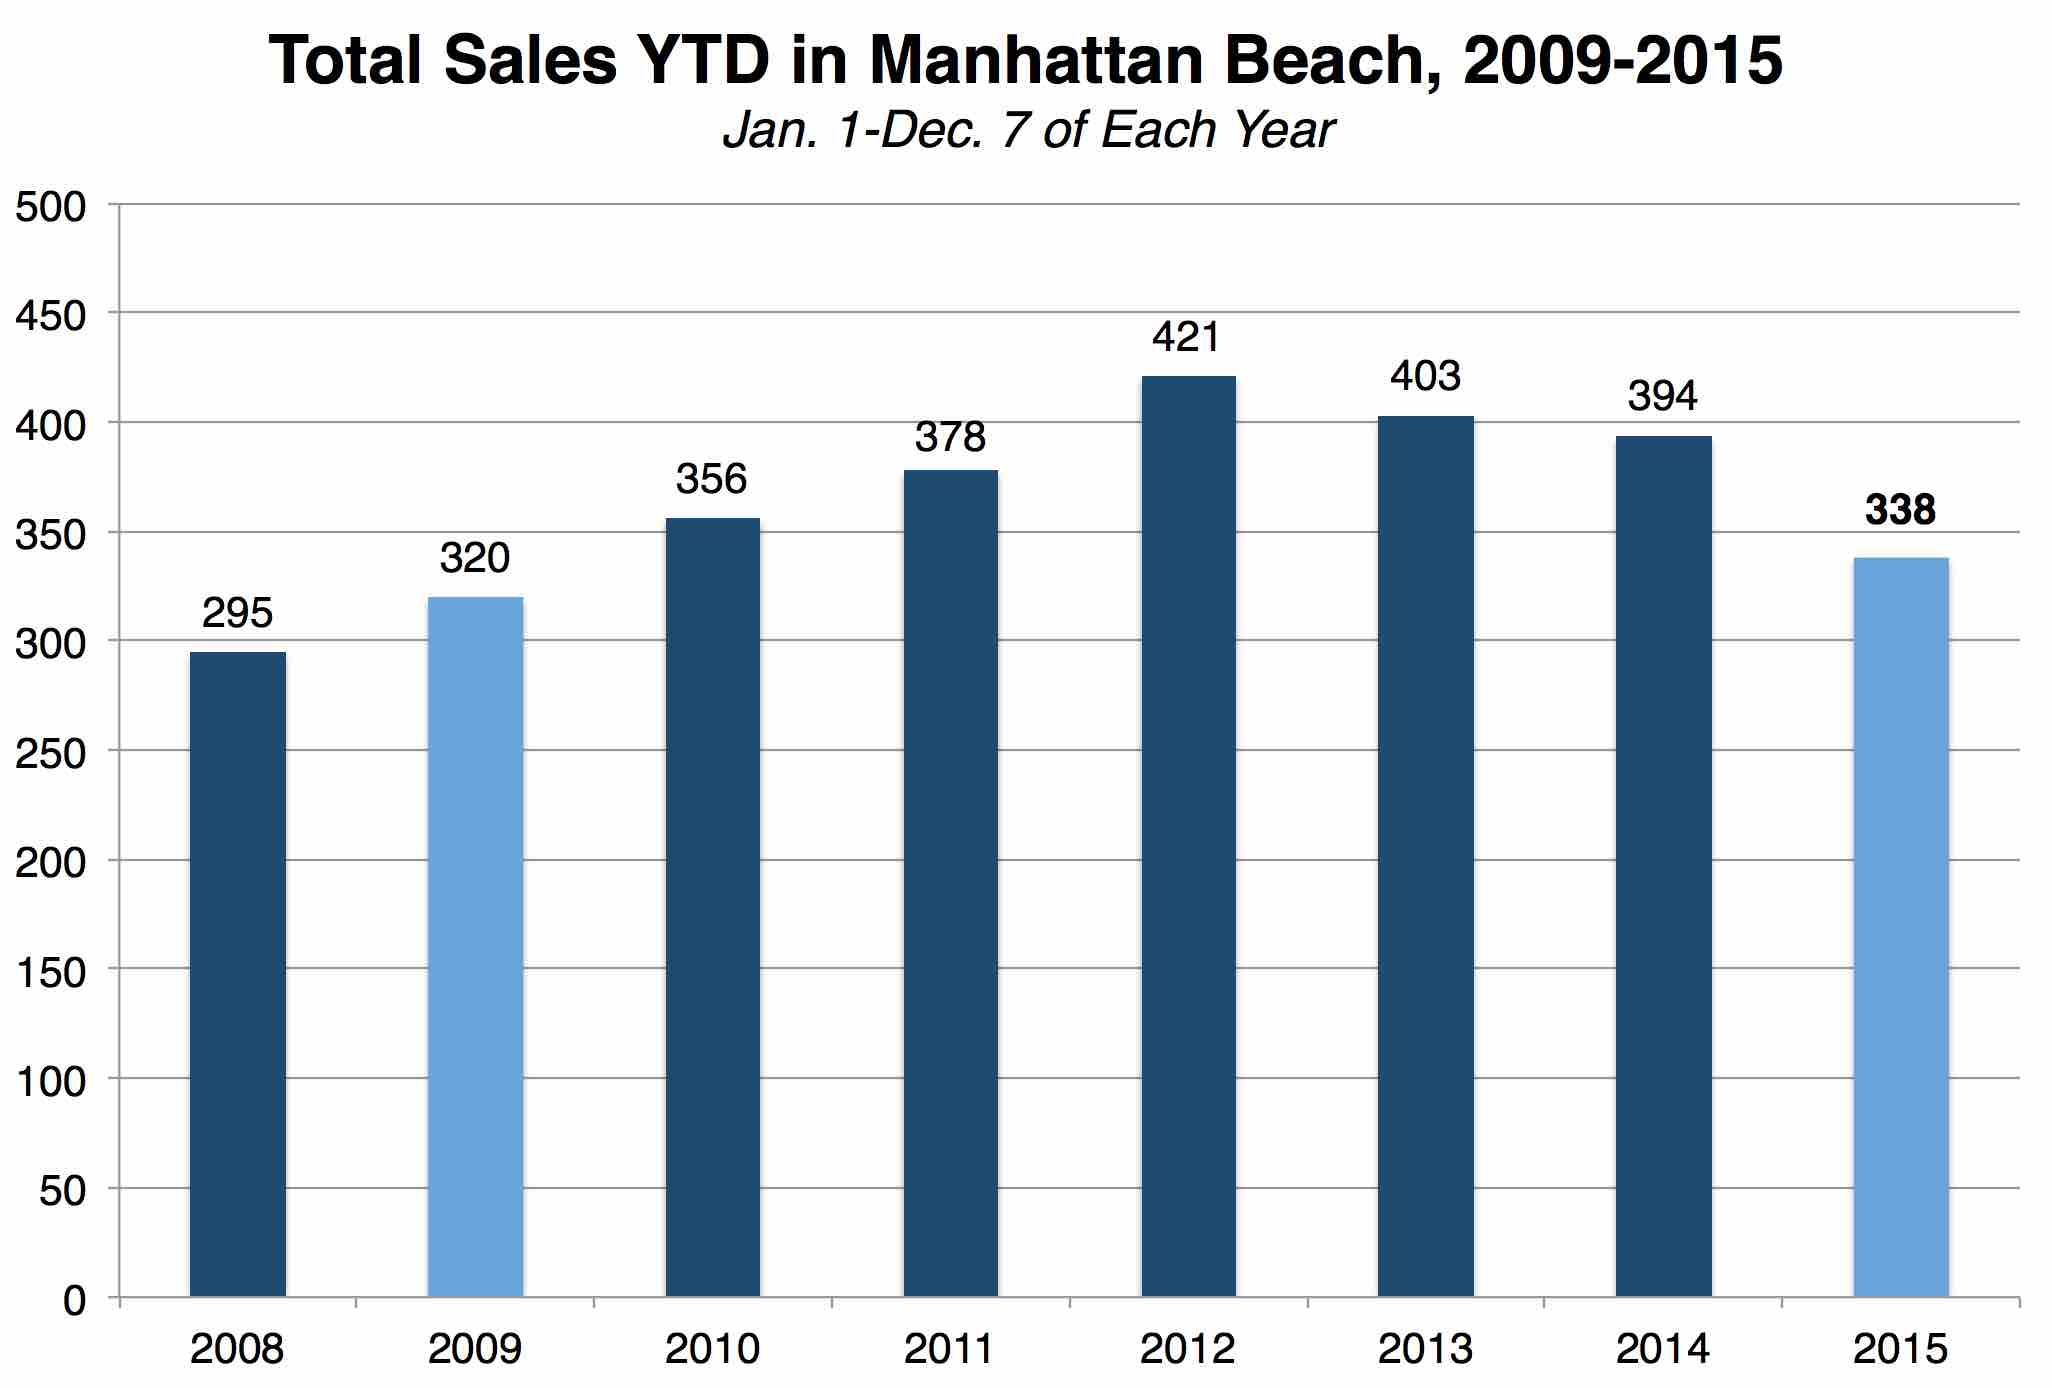
As you see from our chart below, we just took a snapshot of sales YTD for each of the past 7 years. These are MLS-reported closed sales of all residential properties in all areas of MB. The period is Jan. 1 of each year through Dec. 7.

This year, we see total YTD sales at 338, the lowest figure seen since 2009's total of 320 sales.
The year-over-year change is -14%, a notable drop in sales volume from 2014. In fact, we snuck a look at data for the first 3 full quarters of 2015, and we see that October-December sales are actually dragging 2015 further behind the 2014 total. As of October 1, sales were just 10% off of the 2014 pace. Now we're deeper in the hole, as it were.
The story's different on median prices.
Regular readers know that we view median prices as an imperfect measure. There is simply no good way to capture the state of play and the "typical" value of homes in our market. Median is simply the least bad measure. (The "most bad?" Average price. We cringe every time we see it, even on glossy paper.)
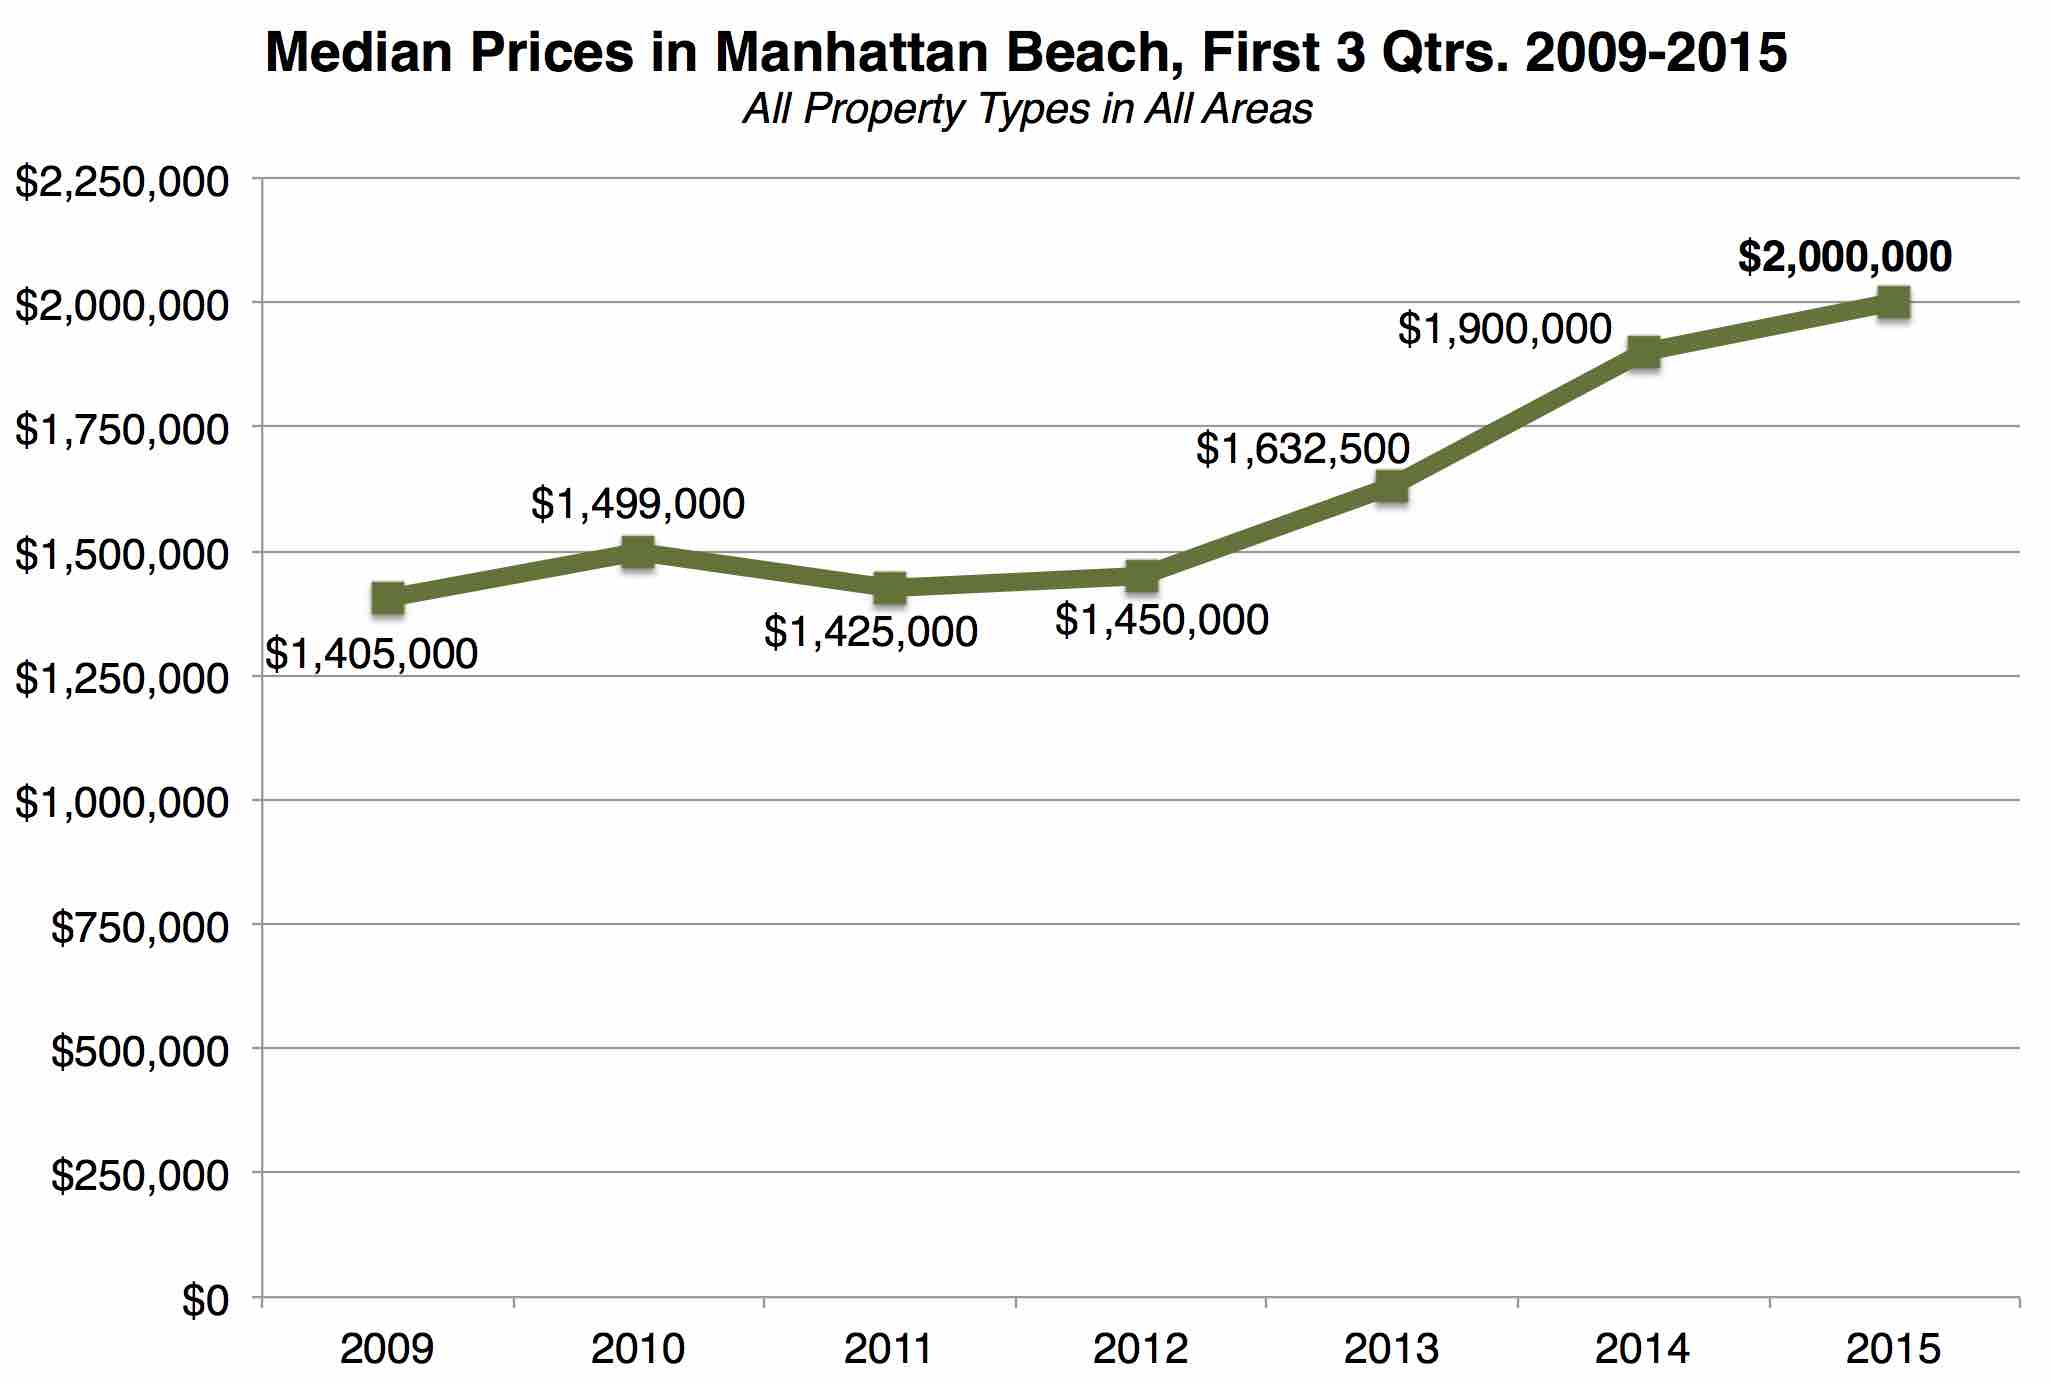
Still, medians capture trends to a degree. So here's a look at median prices as of Sept. 30, capturing the first 3 quarters of this year, against the first 3 quarters of the prior 6 years.
 This year looks likely to continue a 4-year uptrend. This might change a little by year end, but just FYI, we did look at the YTD median prices for 2014 and 2015, and saw that the numbers were almost exactly the same for each year.
A median price around $2.000M will be a record, for sure.
If we count back to the low from 2011, the median is up 40% over 4 years.
But why fewer sales?
You'll note that we began by talking about inventory. There just hasn't been enough property for the number of buyers for property.
So, was the chronic shortage worse this year than in 2013 and 2014? Frankly, it hasn't felt very different.
If there were an actual slackening of demand, you wouldn't see prices rising at the same time. It's a safe observation now that if more people would be willing to sell, we'd see more sales to match that loosening of supply.
So we'll stick with the low-inventory hypothesis, until someone wants to tell us buyers are quitting, or refusing to pay high beach prices, or there's something in the economy that no one else is noticing.
We'll do a full rundown on sales and prices after the books close on 2015, and take note if any of these apparent trends have changed.
Please see our blog disclaimer.
Listings presented above are supplied via the MLS and are brokered by a variety of agents and firms, not Dave Fratello or Edge Real Estate Agency, unless so stated with the listing. Images and links to properties above lead to a full MLS display of information, including home details, lot size, all photos, and listing broker and agent information and contact information.

 It's no coincidence that prices have shot up during the same 3-year span, though there are many factors beyond the simple supply/demand…
 This year looks likely to continue a 4-year uptrend. This might change a little by year end, but just FYI, we did look at the YTD median prices for 2014 and 2015, and saw that the numbers were almost exactly the same for each year.