We noted in yesterday's story that prices are down over the past 2 full years. (See "Pace Slower, Prices Lower.") The median price for SFRs west of Sepulveda was down 22.4%, comparing the first half of 2007 with the first half of this year.
One reason for that drop is that individual home values are, clearly, down.…
We noted in yesterday's story that prices are down over the past 2 full years. (See "
Pace Slower, Prices Lower.") The median price for SFRs west of Sepulveda was down
22.4%, comparing the first half of 2007 with the first half of this year.
One reason for that drop is that individual home values are, clearly, down. You can get more for less in MB today than in 2007.
But the other factor is one we'll focus on now: changes in the
sales mix.Regardless of sales volume, we asked: In which price ranges are the sales happening, and which price ranges are stagnant?
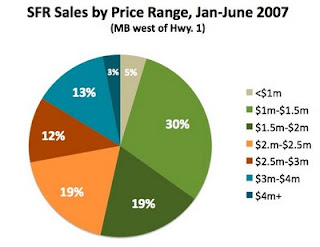
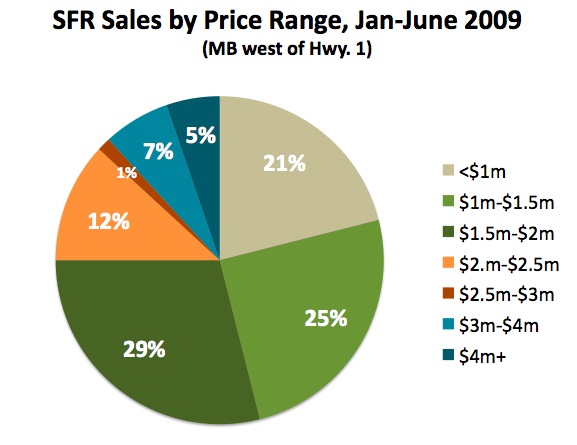
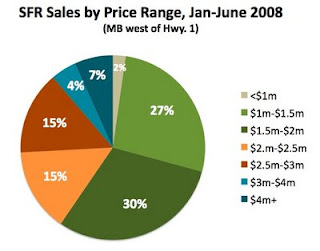
As the following 3 separate charts make clear
(click any chart to enlarge), the big changes in what's selling in 2009 are at the low end (under $1m) and at the higher end ($2m-$3m). The ultra-high-end markets (above $3m) seem fairly steady over time as a share of sales for 3 straight years.
About half of the Jan.-June sales in both 2007 and 2008 occurred
below $2m. In 2009, fully
75% of sales were in that range. That's a significant change in the mix this year, which we'll address further below.
Keep in mind, MLS data – our source here – show only sales that were recorded in the database, excluding off-market sales. (Off-market transactions show up in the DataQuick figures that we are fond of in other analyses.) This is a pretty good picture, but not the whole story.
Looking at these figures, the number that really stands out is the share of sales priced
below $1m. Accounting for only a sliver of all sales in 2007-08 (2-5%), low-end sales hit
21% of all sales in 2009.
The big loser: Sales between $2.5m-$3.0m, which all but vanished in 2009 (1%), after running at 12% and 15% in the prior years.
Just as noteworthy, the whole range of
$2.0m-$3.0m shrank
from 30-31% in 2007-08
to just 13% this year.

Before we get stuck on percentages alone, here are the absolute numbers of sales in the 2 categories with the greatest change:
Sales Priced At $1m or Below
2007: 6
2008: 2
2009: 16
Sales Priced Above $2.5m, up to $3.0m
2007: 15
2008: 13
2009: 1
(We will add a note that there were 2 more sales in 2009 precisely at $2.500m, but we categorized those as $2.0-$2.5m.)
Clearly there has been a burst of
available listings priced below $1m that helped fuel that part of the change in the sales mix. Here are the basic details on the 16 homes that sold at the low end:
- 958 Rosecrans (2br/1ba, 975 sq. ft.) – $650,000
- 2111 Valley (3br/1ba, 950 sq. ft.) – $725,000
- 2500 Oak (3br/2ba, 1350 sq. ft.) – $738,000
- 772 Rosecrans (2br/1ba, 875 sq. ft.) – $744,000
- 1708 Oak (2br/1ba, 850 sq. ft.) – $795,000
- 1733 Elm (3br/2ba, 1325 sq. ft.) – $801,000
- 402 Larsson (3br/3ba, 1800 sq. ft.) – $816,000
- 505 Anderson (4br/2ba, 1850 sq. ft.) – $825,000
- 116 24th Pl (1br/1ba, 525 sq. ft.) – $925,000
- 422 21st Pl (3br/3ba, 1825 sq. ft.) – $930,000
- 2112 Ardmore (3br/1ba, 1125 sq. ft.) – $940,000
- 1828 Walnut (4br/2ba, 1400 sq. ft.) – $950,000
- 3404 Alma (3br/2ba, 1300 sq. ft.) – $950,000
- 4104 Highland (3br/4ba, 2550 sq. ft.) – $970,000
- 3600 Elm (3br/2ba, 1350 sq. ft.) – $975,000
- 1205 Walnut (4br/2ba, 1900 sq. ft.) – $985,075
That's a wild mix of properties. Some were sold for land value, some had sordid backstories, and plenty were simple, small, livable homes that just needed some work to become someone's new home, or investment property.
We're reserving comment here on the range of sales above $3m. That's rarefied air in any market, and it's special here in MB, too. For now we'll note simply that that share of the market hasn't changed a lot in 2009. We'll look into the details in a future post.
Please see our blog disclaimer.
Listings presented above are supplied via the MLS and are brokered by a variety of agents and firms, not Dave Fratello or Edge Real Estate Agency, unless so stated with the listing. Images and links to properties above lead to a full MLS display of information, including home details, lot size, all photos, and listing broker and agent information and contact information.
Based on information from California Regional Multiple Listing Service, Inc. as of May 6th, 2024 at 6:25am PDT. This information is for your personal, non-commercial use and may not be used for any purpose other than to identify prospective properties you may be interested in purchasing. Display of MLS data is usually deemed reliable but is NOT guaranteed accurate by the MLS. Buyers are responsible for verifying the accuracy of all information and should investigate the data themselves or retain appropriate professionals. Information from sources other than the Listing Agent may have been included in the MLS data. Unless otherwise specified in writing, Broker/Agent has not and will not verify any information obtained from other sources. The Broker/Agent providing the information contained herein may or may not have been the Listing and/or Selling Agent.