It's not news that home prices locally are lower now than in in the bubble years. But the number of sales in various price ranges offer some dramatic evidence.
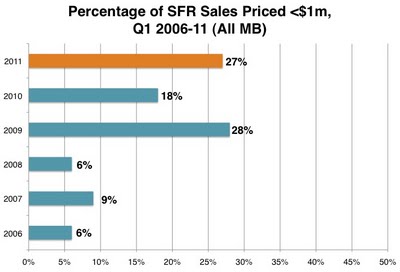
Consider just one number. In the first quarter of 2006, just a sliver,
6%, of all homes sold in Manhattan Beach (all areas) went for less than $1m.
This…
It's not news that home prices locally are lower now than in in the bubble years. But the number of sales in various price ranges offer some dramatic evidence.
Consider just one number. In the first quarter of 2006, just a sliver,
6%, of all homes sold in Manhattan Beach (all areas) went for less than $1m.
This year (Q1 '11), more than a quarter of homes sold for less than $1m –
27%. Statistically, that's a 450% increase in the proportion selling below that magical $1m benchmark.
Our chart here
(click to enlarge) draws a pretty stark line between the 2006-2008 period and the past 3 years. The sales mix changed drastically in the first true post-bubble year, 2009.
This year's entry-level sales in the first quarter look more like that year's, with about the same share going for less than $1m. However, with substantially more closed sales this year (64 in Q1 this year, compared to 40 in Q1 '09), that also means more actual homes trading below $1m.
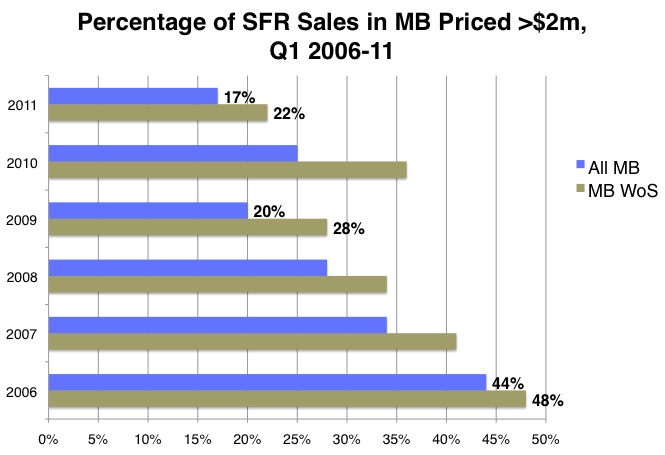
Now, go bigger.
Back in that late-boom year of '06, something near half the homes sold in Q1 went for $2m or more (
44%). (The median price that quarter was $1,972,500– see "
How Q1 of '11 Compares.")
This year, almost all (83%) of the homes sold in MB in Q1 sold for less than $2m – just
17% were above that mark this time.
MB West of Sepulveda fared about the same over this 6-year period. There are always a few more sales above $2m west of the highway.
Though the big-dollar sales seem to get all the headlines, they still made up less than a quarter (22%) of the sales in the first part of 2011, down from 48% in the rush of 2006.
For both MB west of Sepulveda and citywide, we see that the share of homes selling above $2m was at a 6-year low this year.
So, if you sense that entry-level prices and typical prices around MB have come down somewhat dramatically – you're right. And if you think the high end is chugging along as well as ever – well, maybe, but it's no longer a dominant segment of the market.
Nerdy notes: These data on the "sales mix" in MB come from MLS-reported sales in Q1 of the years at issue. We'll take one more look at how sales by price range have changed over recent years in another post soon.
Please see our blog disclaimer.
Listings presented above are supplied via the MLS and are brokered by a variety of agents and firms, not Dave Fratello or Edge Real Estate Agency, unless so stated with the listing. Images and links to properties above lead to a full MLS display of information, including home details, lot size, all photos, and listing broker and agent information and contact information.
Based on information from California Regional Multiple Listing Service, Inc. as of July 27th, 2024 at 3:45am PDT. This information is for your personal, non-commercial use and may not be used for any purpose other than to identify prospective properties you may be interested in purchasing. Display of MLS data is usually deemed reliable but is NOT guaranteed accurate by the MLS. Buyers are responsible for verifying the accuracy of all information and should investigate the data themselves or retain appropriate professionals. Information from sources other than the Listing Agent may have been included in the MLS data. Unless otherwise specified in writing, Broker/Agent has not and will not verify any information obtained from other sources. The Broker/Agent providing the information contained herein may or may not have been the Listing and/or Selling Agent.