
For now, it's still slow going out there in the South Bay real estate market.
The trends we're seeing in Manhattan Beach are matched across the major South Bay cities and areas. For the data we're looking at here, that will include all three beach cities (Manhattan, Hermosa, Redondo), Torrance, and the…
For now, it's still slow going out there in the South Bay real estate market.
The trends we're seeing in Manhattan Beach are matched across the major South Bay cities and areas. For the data we're looking at here, that will include all three beach cities (Manhattan, Hermosa, Redondo), Torrance, and the whole of the Palos Verdes Peninsula.
We're looking at 10+ years' worth of data in 4 different categories, grouping all South Bay data together.
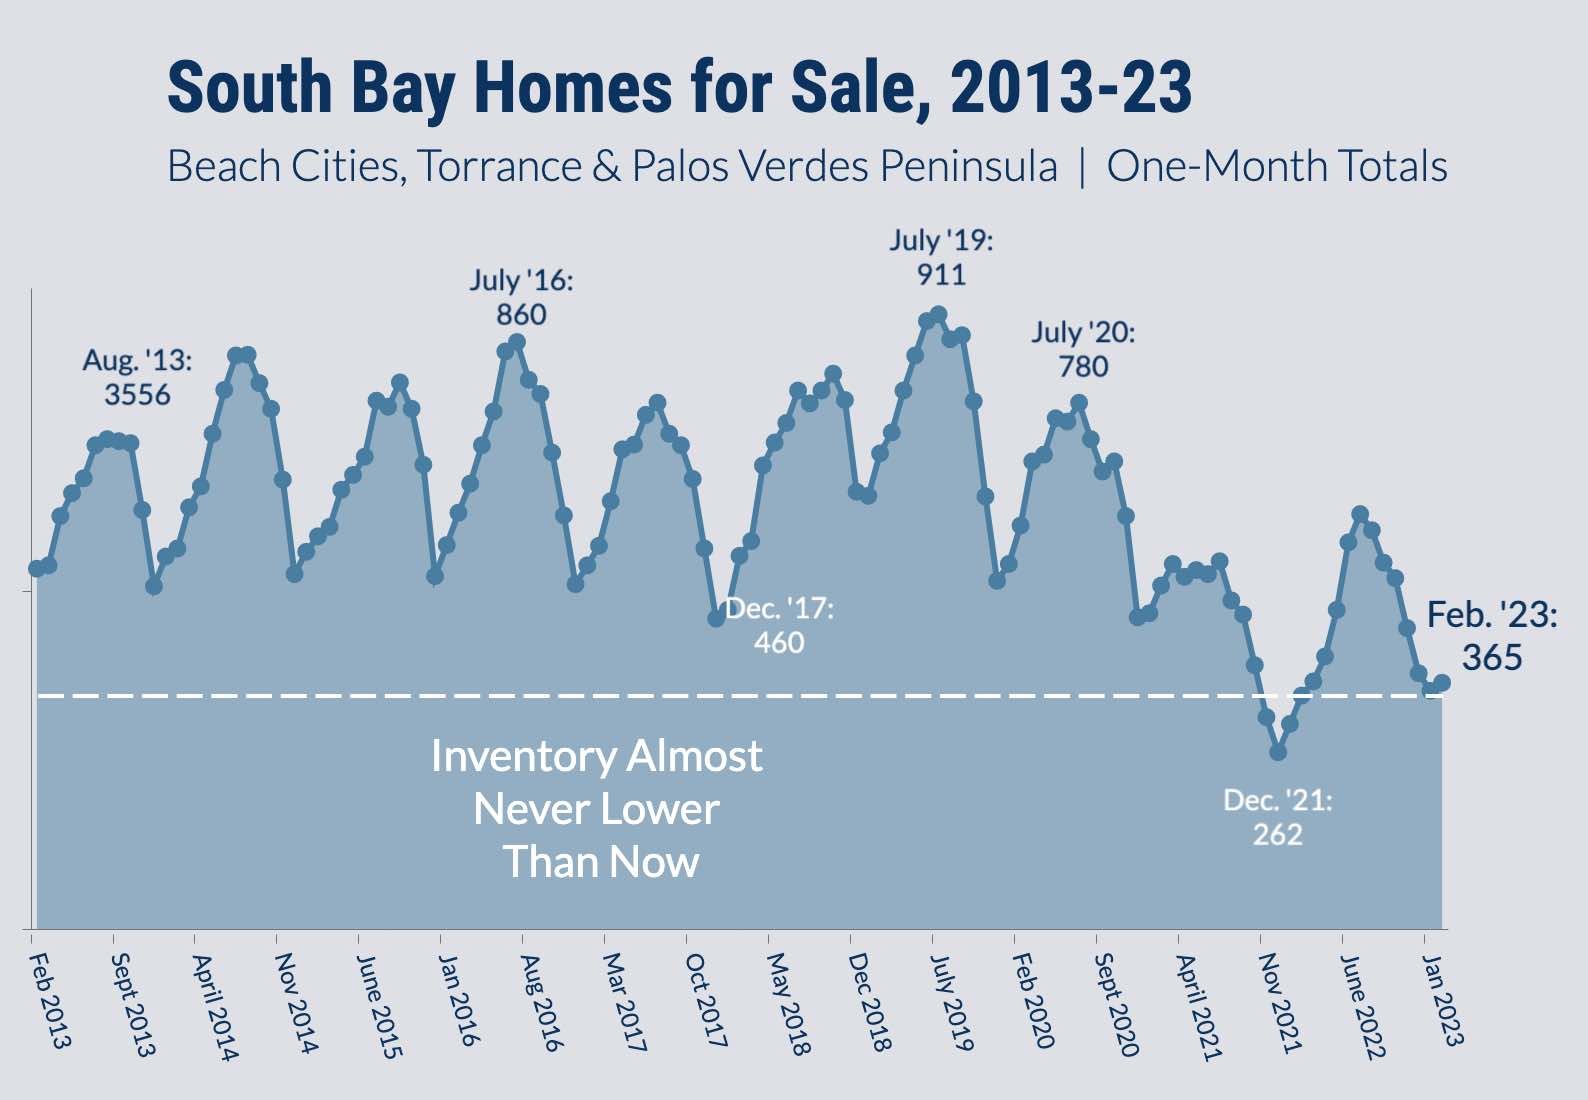
Chronically Low Inventory
Not only has the pandemic-fueled buying frenzy come to a halt, people are pretty much deciding to stay where they are, period.
Inventory is absolutely pinched across the whole South Bay, stuck at 365 at the start of this month. There has only been one time over the past 10-years-plus where inventory was lower than right now. It was a brief period bracketing December 2021, a time that seemed to establish this trend of ultra-low numbers of homes for sale that we're still living with today.
It's important to understand how unusually low this level of inventory really is. The chart does a good job, with the white dotted line representing inventory at the end of February against all prior years. Even a major low point – December 2017 – had 26% more inventory than we see today.
You aren't going to see many homes sold when there are fewer homes for sale.
The toughest nut to crack is: What's behind this boycott by would-be sellers? What could change peoples' reluctance to sell, restoring more "normal" levels of inventory?
We suspect there are two main factors:
1) Low mortgage rates "locked in" versus current, higher market rates. It looks much less affordable and desirable to sell if you have to buy at current rates.
2) Fewer options for a trade-up/trade-down due to low inventory. Why sell if you don't know where you're going? This is a negative feedback loop that has dashed many would-be sellers' hopes over the last 2 years.
A third possibility, that dreadful market conditions are deterring sellers, is conceivable, but we don't really see that it's all that bad out there for sellers right now. They're pretty popular!
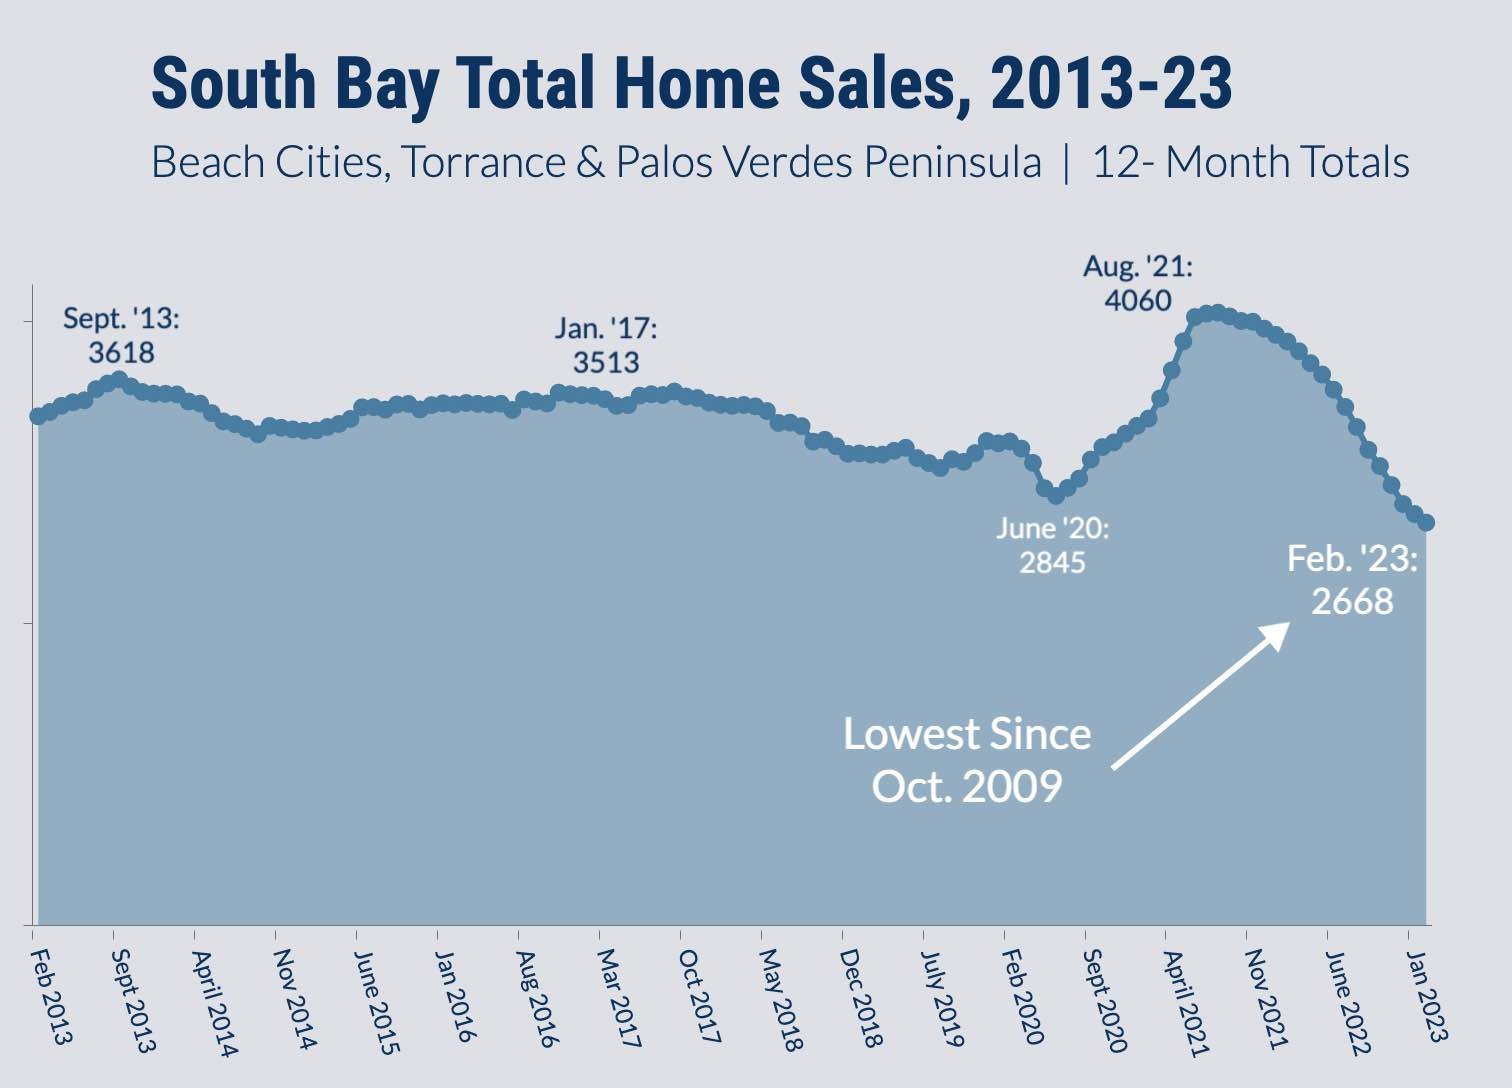
Low Home Sales Totals
As noted above, low inventory begets lower numbers of sold homes.
But it's not really that simple. The number of pending sales is also a measure of demand. Demand does appear to be quite a bit weaker today across the South Bay.
Just compare the 2020-21 periods on the two charts above. Inventory was vanishing at an incredible clip from late 2020 through the end of 2021. And yet the number of sales was world-beating at the same time. Demand was super strong. Inventory was low because everything was being bought.
Buyers are having a harder time getting into mortgages today, at least for the homes they might want. Many have "resigned" for now. People buying now are more likely to have an immediate need, not to be dazzled by the prospect of an upgrade.
We looked back at the data going back another 5 years earlier than what you see in our chart. The 12-month sales total at the end of Feb. 2023 (2,668 sales) is lower than any point before October 2009.
The period May 2008-Oct. 2009 all saw lower sales totals than right now. Early 2008 was better.
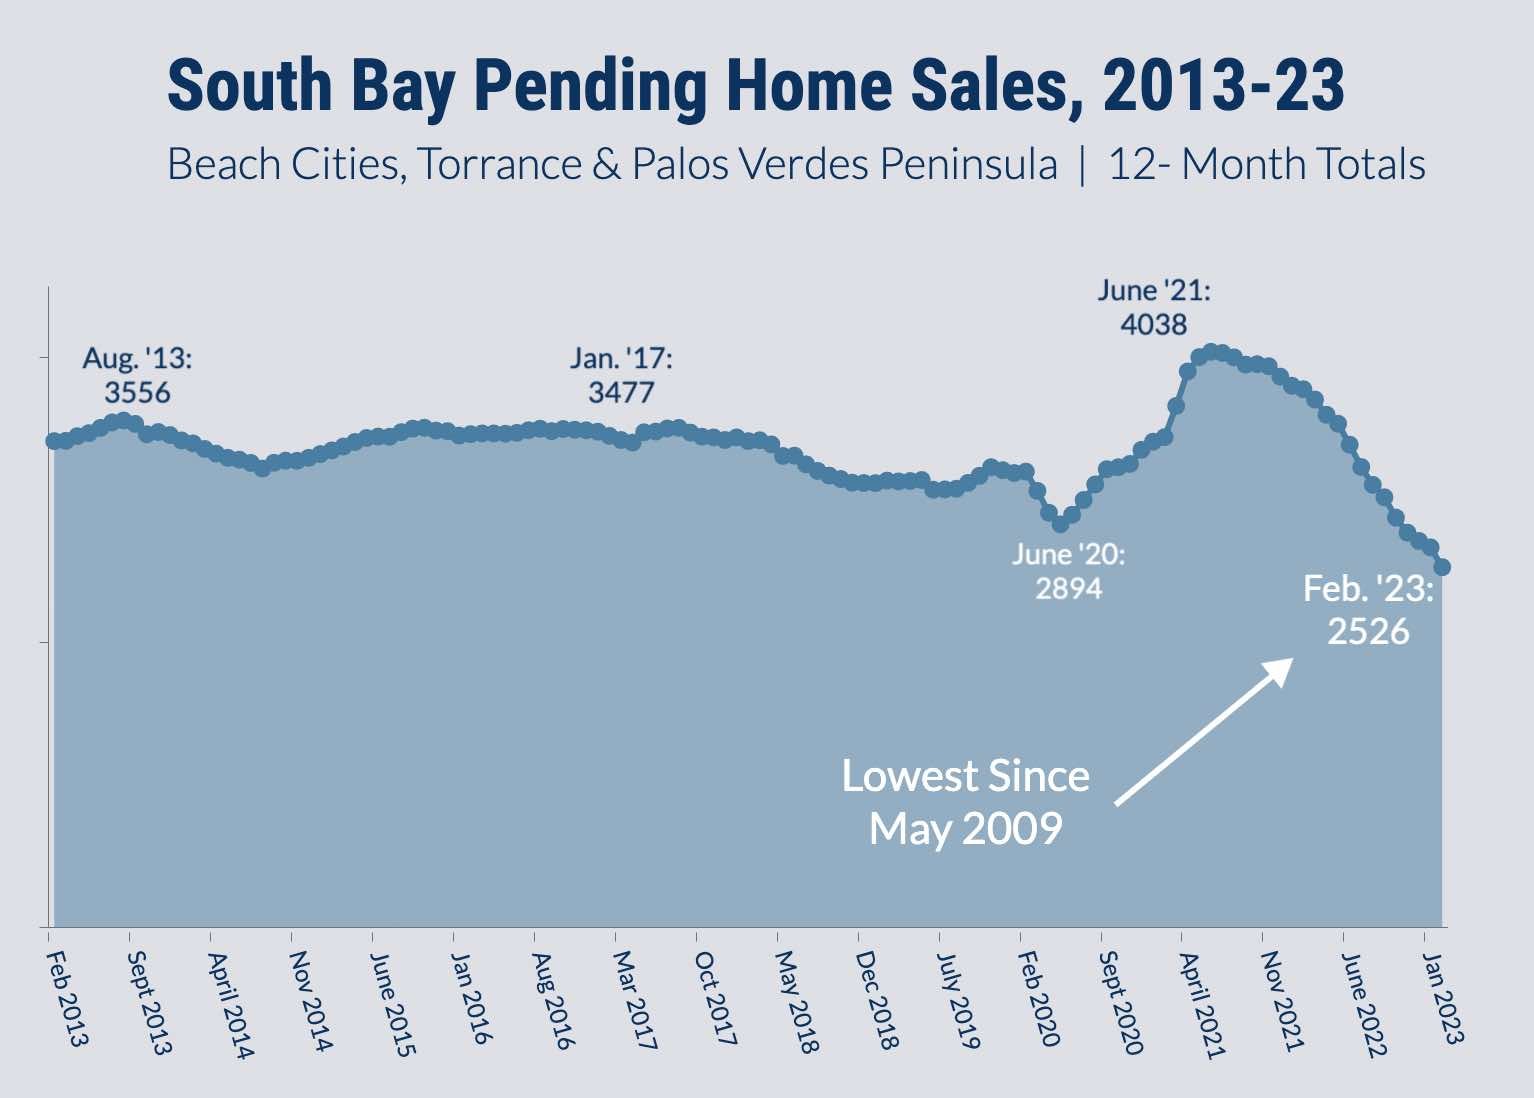
Low Numbers of Pending Sales
Pending sales are the first step to closed sales.
The patterns in this chart mirror closed sales trends, just set back in time about 30-60 days.
It's a bit depressing to think that demand for homes across the South Bay is now the lowest it's been since the immediate wake of the 2008 financial crisis.
Today's economic times are, quite simply, not like then.
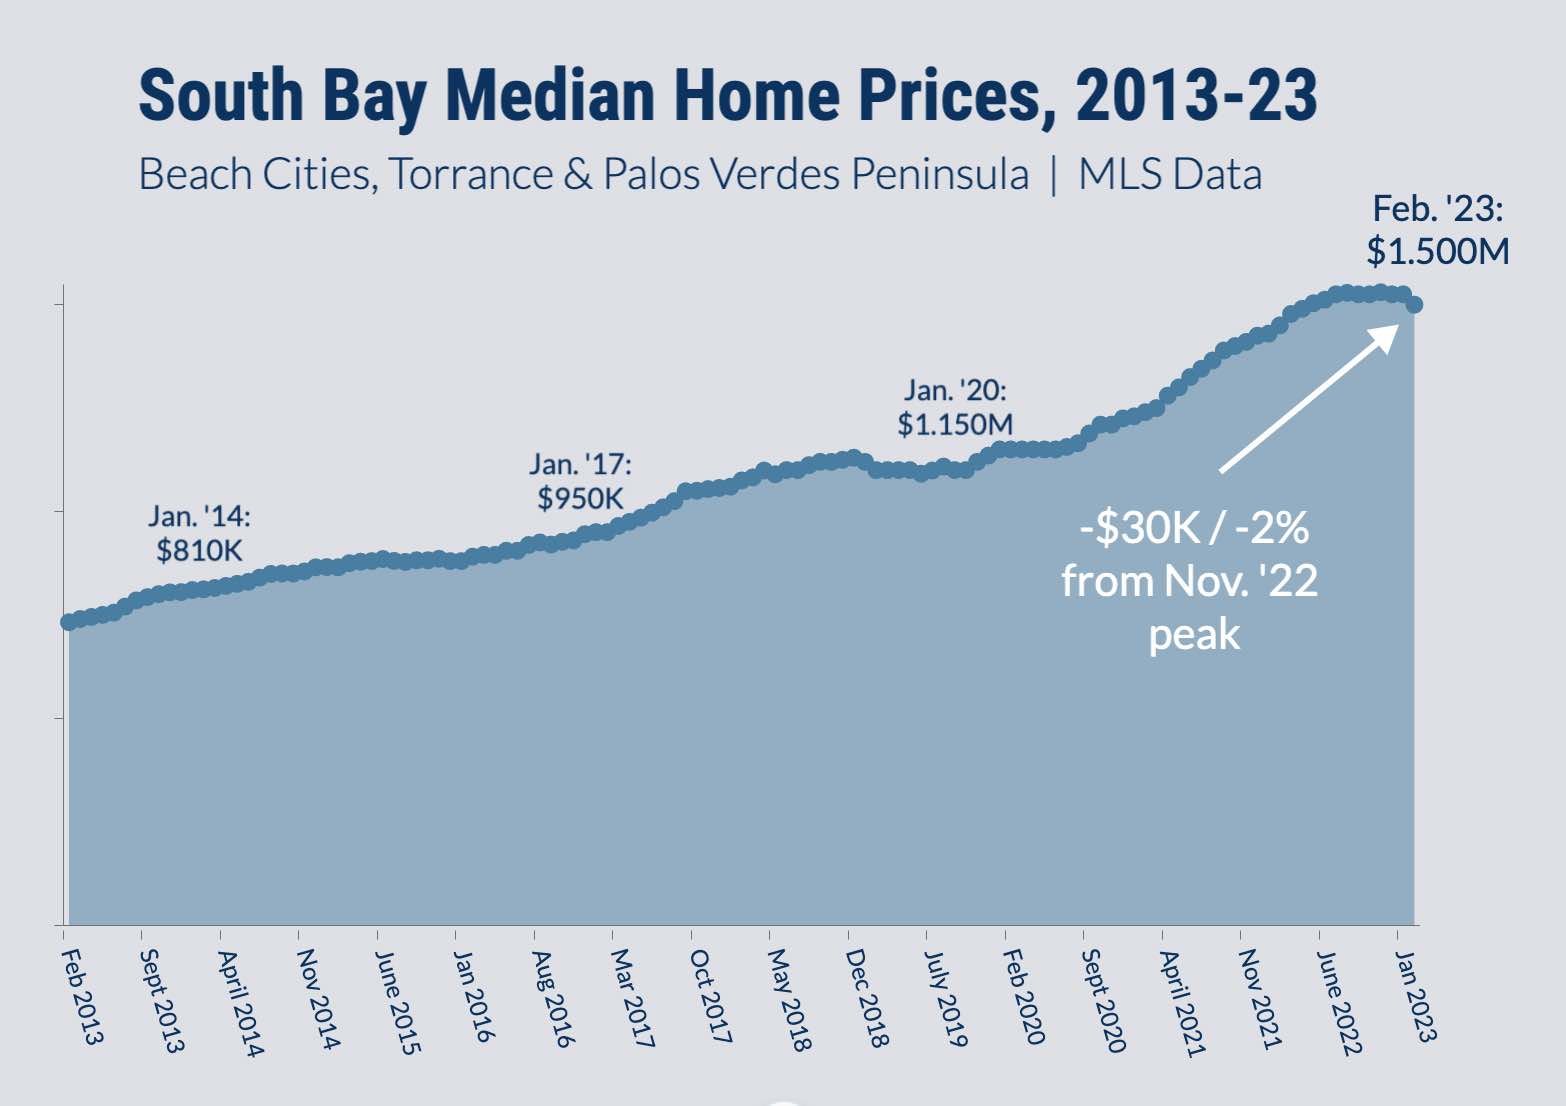
Gently Dropping Median Home Price
The story of the past 10 years-plus across the South Bay is one of persistently rising median home prices.
And yet, we're tracking a modest 2% drop in the median price from Nov. 2022 to the end of Feb. 2023.
We look at 12-month rolling totals here to gather the most representative data possible. As you see further above, the median price is drawn from 2,600-3,500 sales from MB down to PV.
There have been precious few months from 2013-present where there was any kind of "wobble" in the median price for the region, where it dropped even a little. The median price typically rebounded quickly if it did dip, then began rising again.
There is an overall flattening seen in 2019's data. That was a year when the market appeared to be almost exhausted in Manhattan Beach, so it's understandable that the whole South Bay was seeing something similar.
A main point here is that there have been no persistent downtrends in local median prices during the 10-year period represented by this chart.
Not seen here: There was a a significant drop in South Bay median home prices beginning in Spring 2008, with a lot of flat data over years until prices recovered their 2008 levels in Fall 2014.
Outlook for the South Bay
It may be that we're paying now for the sugary candy of low rates that had our market in hyperdrive for a couple of years.
There is still a lot to work out to get the market moving, with both a supply and demand crunch.
Do we need ultra low rates again to get there?
Please see our blog disclaimer.
Listings presented above are supplied via the MLS and are brokered by a variety of agents and firms, not Dave Fratello or Edge Real Estate Agency, unless so stated with the listing. Images and links to properties above lead to a full MLS display of information, including home details, lot size, all photos, and listing broker and agent information and contact information.


