We're returning to a theme you're heard from us a few times this year.
Has the "high end" in Manhattan Beach gone wobbly?
Once again, with data, we're having trouble proving this to be true, in the larger sense.
It's the conventional wisdom, of course, and you know how hard it can be to fight the…
We're returning to a theme you're heard from us a few times this year.
Has the "high end" in Manhattan Beach gone wobbly?
Once again, with data, we're having trouble proving this to be true, in the larger sense.
It's the conventional wisdom, of course, and you know how hard it can be to fight the conventional wisdom.
Sure, there is evidence for the fact that higher-priced listings are taking longer to sell and taking price cuts.
But from the perspective of the market as a whole, the high end is not obviously suffering.
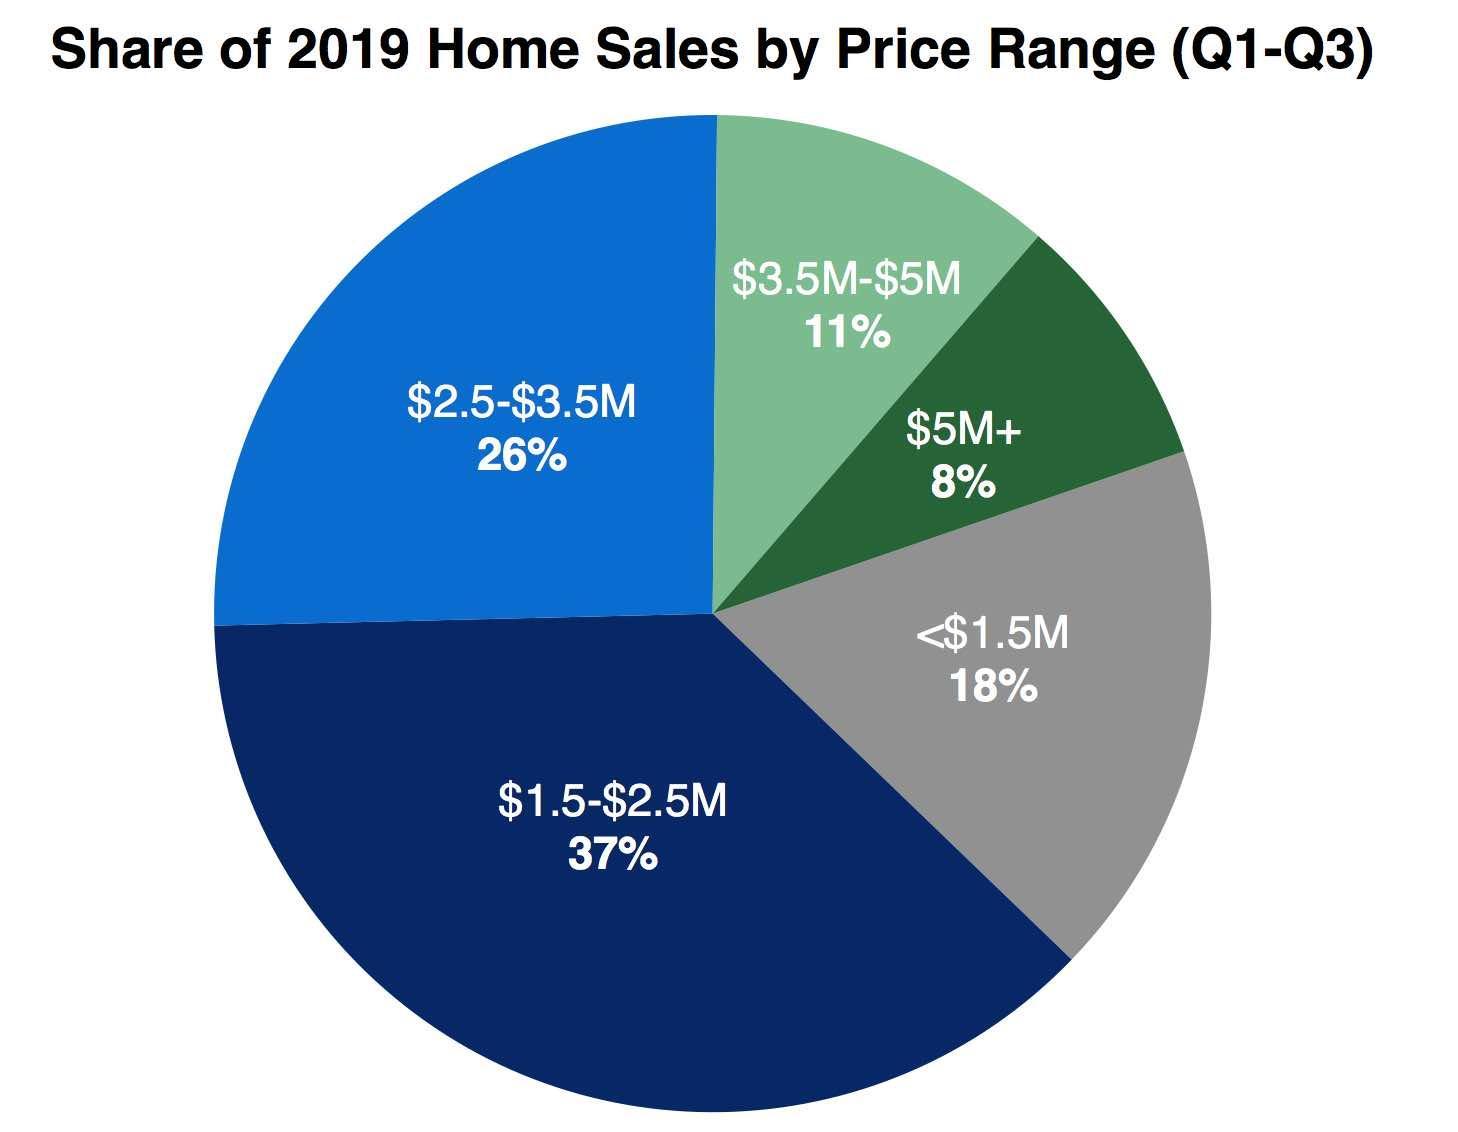 Our newest chart looks at the number of home sales in Manhattan Beach by price range.
From Jan. 1-Sept. 30, 2019, you see that 19% of homes sold in Manhattan Beach were priced at $3.5M and above.
For the same period of 2018, that highest-of-the-high end share of sales was also at 19%.
That's no change.
We recently noted that active inventory at this higher end ($3.5M+) has actually dropped year-over-year by 7%, from 47% of homes for sale in 2018 to 40% this year. (As of mid-September.) (See "Where the Inventory Is (by Price).")
So you see the same proportion of higher-end sales despite less inventory in the price range. No glut, no notable dropoff in sales, percentage-wise.
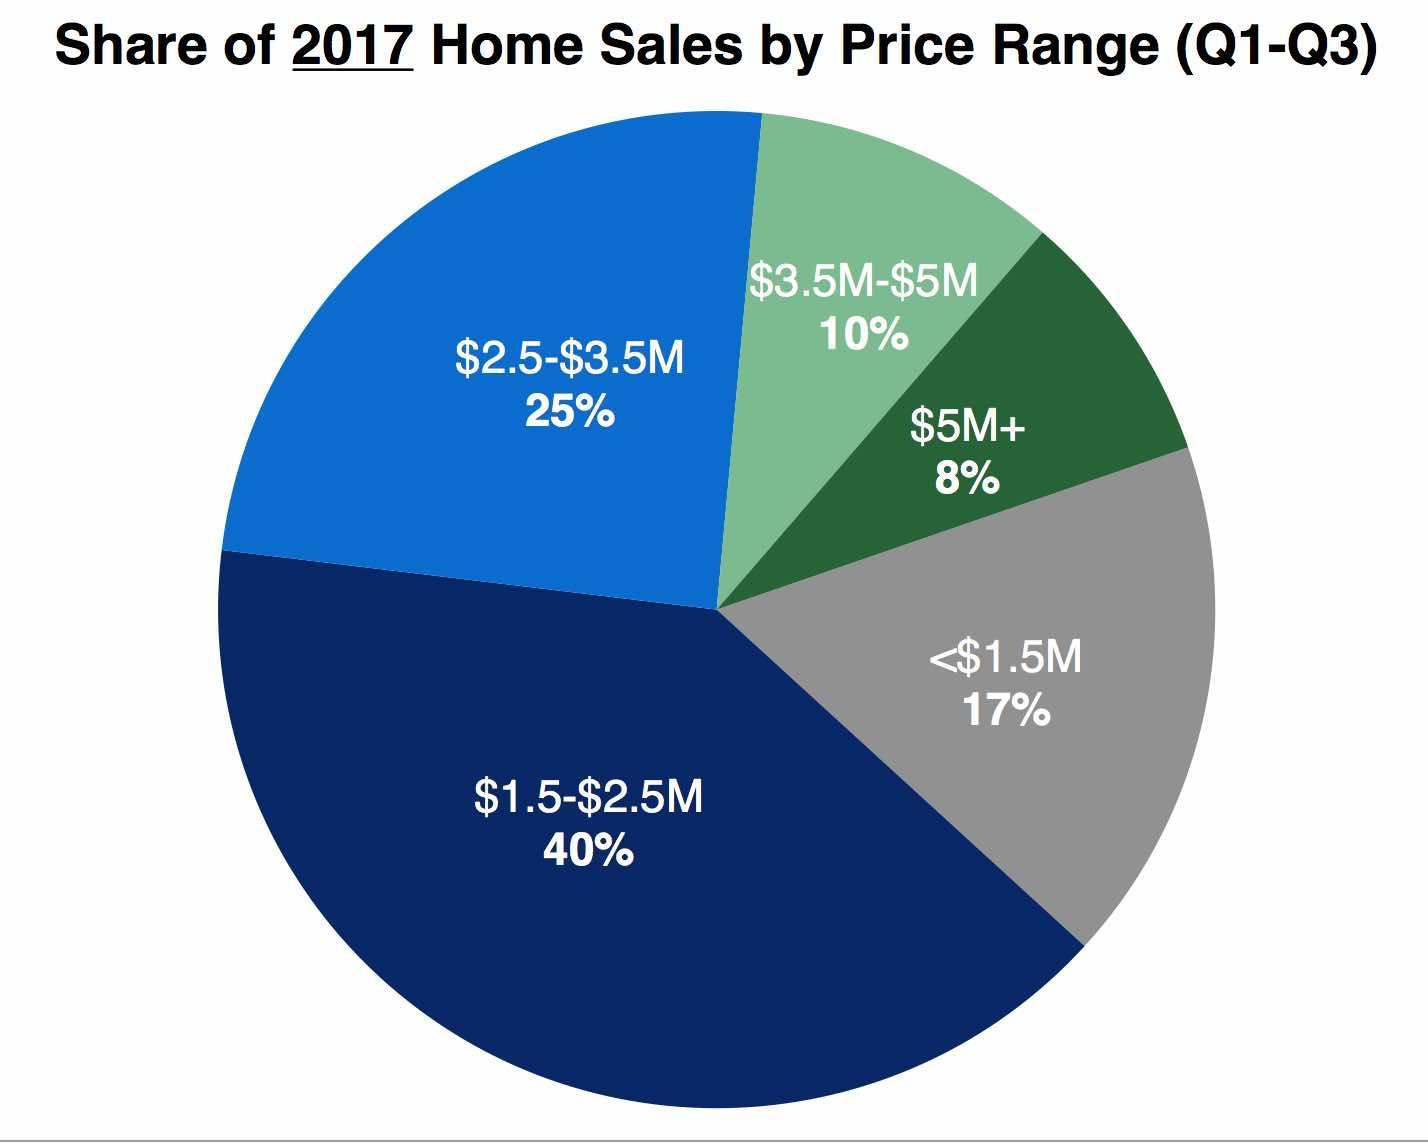
There were slightly fewer actual sales in the $3.5M+ range, 56 this year (Q1-Q3) versus 60 last year and 61 in 2017.
Even if you want to take note of that little drop, go back to 2015, which saw 28 sales of $3.5M+. This year, we're at double that level. We'll take "flat" over a return to 2015-type numbers.
What about current market activity?
At mid-September, 28% of homes in escrow in Manhattan Beach were at the $3.5M+ price point. That's comparable to 26% each of the prior two years. Only 6% of pending sales in mid-Sept. 2016 were in this price range.
This is all a drawn-out way of saying much the same thing: Our market, as a whole, isn't showing distress at the high-end segment. The past 3 years are remarkably consistent with each other, and going much further back, you actually do see some dimmer data.
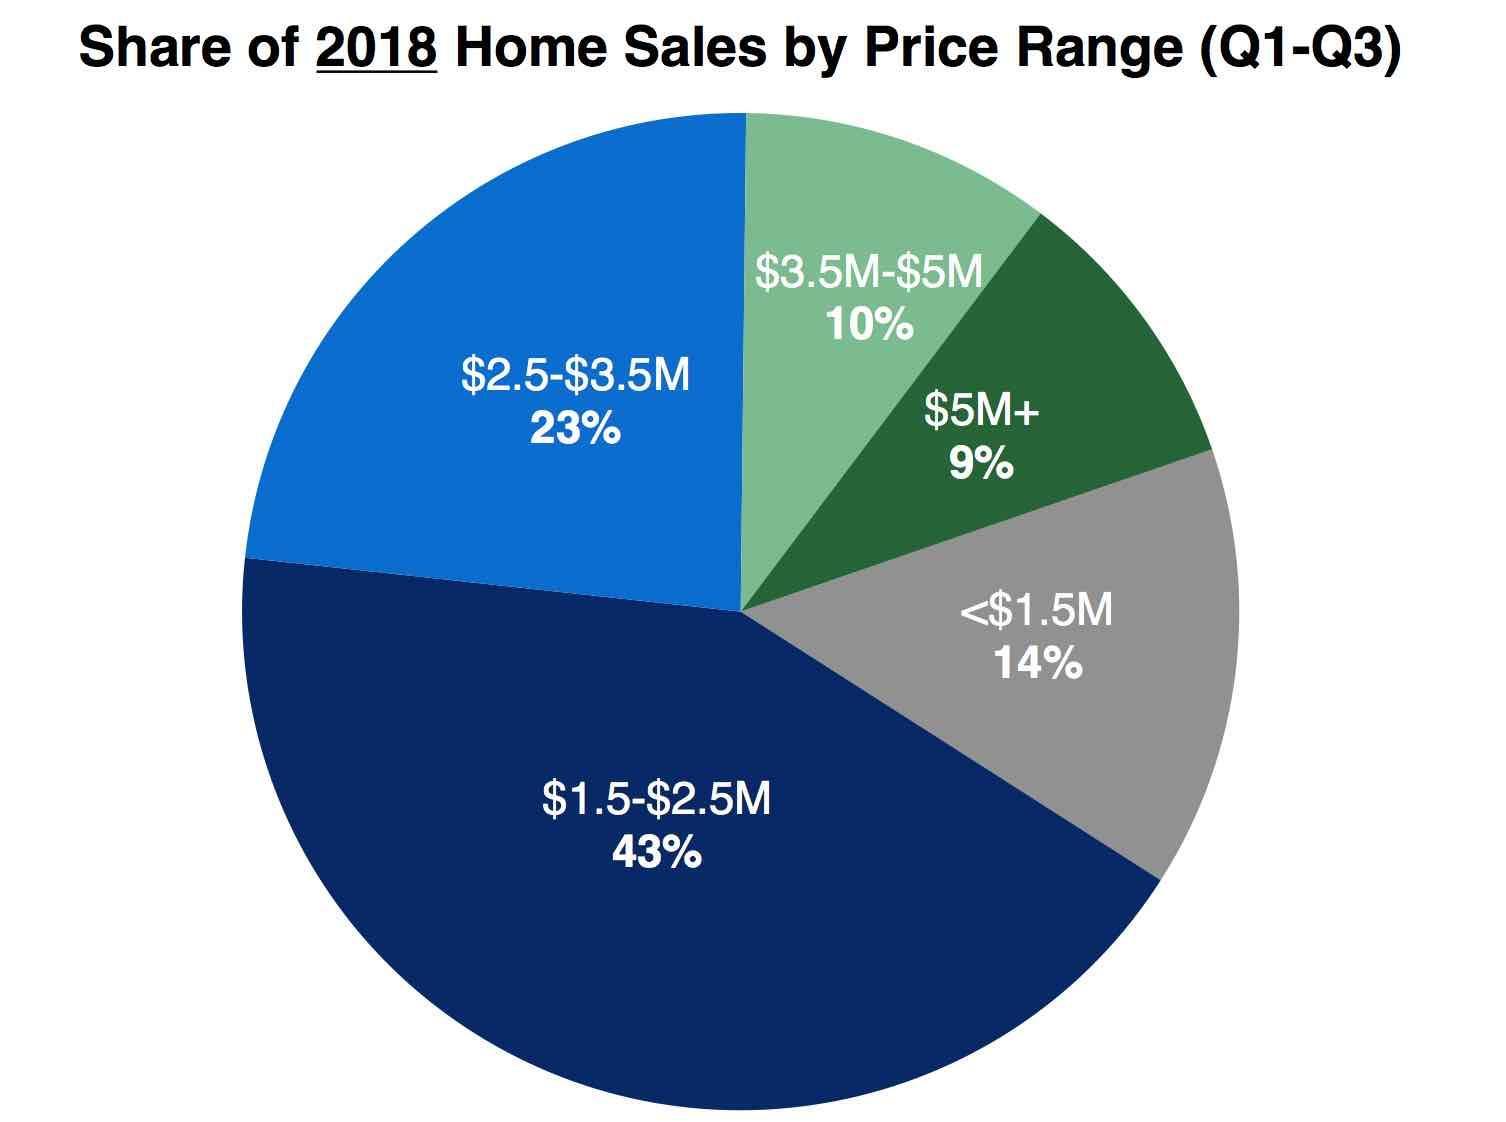 We're going to wrap up with with charts simply underscoring the very similarity of home sales totals over these past three years.
You can compare these final two pie charts with the 2019 chart that leads off this post. The consistency among them is the story.
 What you see is that in each of these recent years, the greatest single category of home sales is always the $1.5M-$2.5M price range.
This year, that price range accounted for 37% of all home sales, less of a share than in 2018 (43%) or 2017 (40%).
The movement, such as it was, from 2018 to 2019 was in the form of more sales in the next-highest and next-lowest categories, +3% for the $2.5M-$3.5M segment and +4% for the under-$1.5M segment.
Going back to 2015, the share of sales under $1.5M was notably higher (29%) and the high-end segment of $3.5M+ was much lower (10%).
All in all, whatever is going on with specific listings and prices at the higher end, we do not have an obvious market-wide problem.
That's little comfort if your $4M-to-$8M listing isn't selling, we know.
But supply and demand are running at pretty similar levels from a market-wide perspective. If that were to change, the individual listings in the higher price range might face greater competition for fewer buyers. Big picture, that's just not what is happening today.
Please see our blog disclaimer.
Listings presented above are supplied via the MLS and are brokered by a variety of agents and firms, not Dave Fratello or Edge Real Estate Agency, unless so stated with the listing. Images and links to properties above lead to a full MLS display of information, including home details, lot size, all photos, and listing broker and agent information and contact information.


