If you follow MBC's occasional trend stories, you know that the pace of SFR sales in town has been down, and down again, over the couple of years we've been publishing local market tracking.
Late last year, it was clear that 2008 would be the worst year in terms of the number of sales in the past two decades. (See…
If you follow MBC's occasional trend stories, you know that the pace of SFR sales in town has been down, and down again, over the couple of years we've been publishing local market tracking.
Late last year, it was clear that 2008 would be the worst year in terms of the number of sales in the past two decades. (See our Sept. 2008 story, "
Turns Out '08 Got Worse," for more.)
It was such a foregone conclusion, we never really wrote up the final results here in 2009. However, local realtor and blogger Kaye Thomas did in
this post with data going back to 2005, and we let it go at that.
There's something new to add to the story now. For the first time, MBC has access to data from lots of comparable, nearby markets. So now we'll begin a series of examinations of how MB's sales activity compares with other markets in the LA area.
First up: 2008 sales in MB and the nearby beach communities of Hermosa Beach and Redondo Beach.
It turns out that Hermosa and Redondo have also run into just about the same kind of tough times for real estate sales.
A
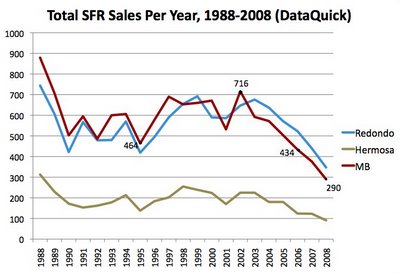
ll 3 beach cities pushed down to find new lows for SFR sales in 2008.
(Click graph to enlarge.)Data spanning two decades' worth of housing sales show MB the furthest off its recent peak (2002), with Redondo's trendline tracking closely and also off greatly from a 2003 peak. (The degree to which Redondo's sales decline tracks MB's is especially noteworthy.)
All of these figures come from
DataQuick, the real estate information service. As we've noted before, DataQuick figures are the most comprehensive, because the service picks up
all SFR transactions, not just sales reported on the MLS.
An MBC reader has, once again, purchased datasets from DataQuick and provided us with permission to chart and publish compilations from them. (With a few restrictions imposed by the data provider.) More on that toward the end of this post.
The data in this chart covers SFR sales only in all areas of MB, Hermosa and Redondo. (The Hermosa sales volume is much lower here partly because about half of all home sales there are condos/townhomes excluded from the mix.)
These figures show us that the number of sales in all 3 markets has been declining steadily since 2002-03. Funny, you never heard anyone worrying about that until recently.
The first (big) hint of trouble ahead for MB was 2006, when the number of sales hit a low for this 21-year period at
434 SFR sales. That was a bit below the 464 sales seen in 1995, a year when all 3 beach cities' markets dipped to their previous low points for this period.
We now look back at 2006 and recognize that it was the year when our local market turned.
Hermosa also broke to a new low in 2006 (124 sales, below 1995's 138) and Redondo held off until last year, finally digging to a new low of 347 sales, down from 419 in 1995.
The 2007 and 2008 figures for MB pushed further down from the new low set in 2006, with
290 last year, 59% below the peak of
716 in 2002.
If it seems unfair to compare against a peak, just look at that spike in the late 1980s, where the chart begins. DataQuick recorded
879 sales in 1988 –
a rate of 73 per month! Let's not compare to that.
Maybe the fairest reading of how anemic 2008 was comes from looking at an average.
Across these 21 years, we see
577 as the average number of SFR sales in MB per year. The weak 290 sales in 2008 was just half (
50.3%) of that average pace.
Hermosa's 91 sales in 2008 lagged a bit more – at
48% of the average rate of 190 sales per year. Redondo held up better, with 2008 sales at
62% of the city's average pace (559).
So how is 2009 going? The first quarter wasn't kind to any of these markets. More on that in a future post.
All of this new analysis is possible thanks to a gift from a loyal reader, for which we're thankful all over. The first time we got similar DataQuick data from this reader, MBC produced some of the blog's most popular posts. (See "
Top MBC Stories.")
We can do some more to compare and contrast with our neighboring beach cities in future posts. And there are lots of other markets we will look at also. Over the coming weeks we'll crunch the numbers and share some insights.
Please see our blog disclaimer.
Listings presented above are supplied via the MLS and are brokered by a variety of agents and firms, not Dave Fratello or Edge Real Estate Agency, unless so stated with the listing. Images and links to properties above lead to a full MLS display of information, including home details, lot size, all photos, and listing broker and agent information and contact information.


