Just last week, we gave you a first look at Q3 data.
With a rising median price but sharply lower sales totals, it was a tale of two cities, but for one city.
Now we'll dive quite a bit deeper to look at even more data telling what may seem to be a mixed story.
It's very popular now to talk about this real estate market being in transition. The reality is, there are enough data points now to tell almost any story that you want.
The "transition" is felt directly and deeply in the case of some buyers and sellers, to be sure. But evidence is still slow to develop for the market more broadly.
Inventory Was Low, But Above 2021 Level
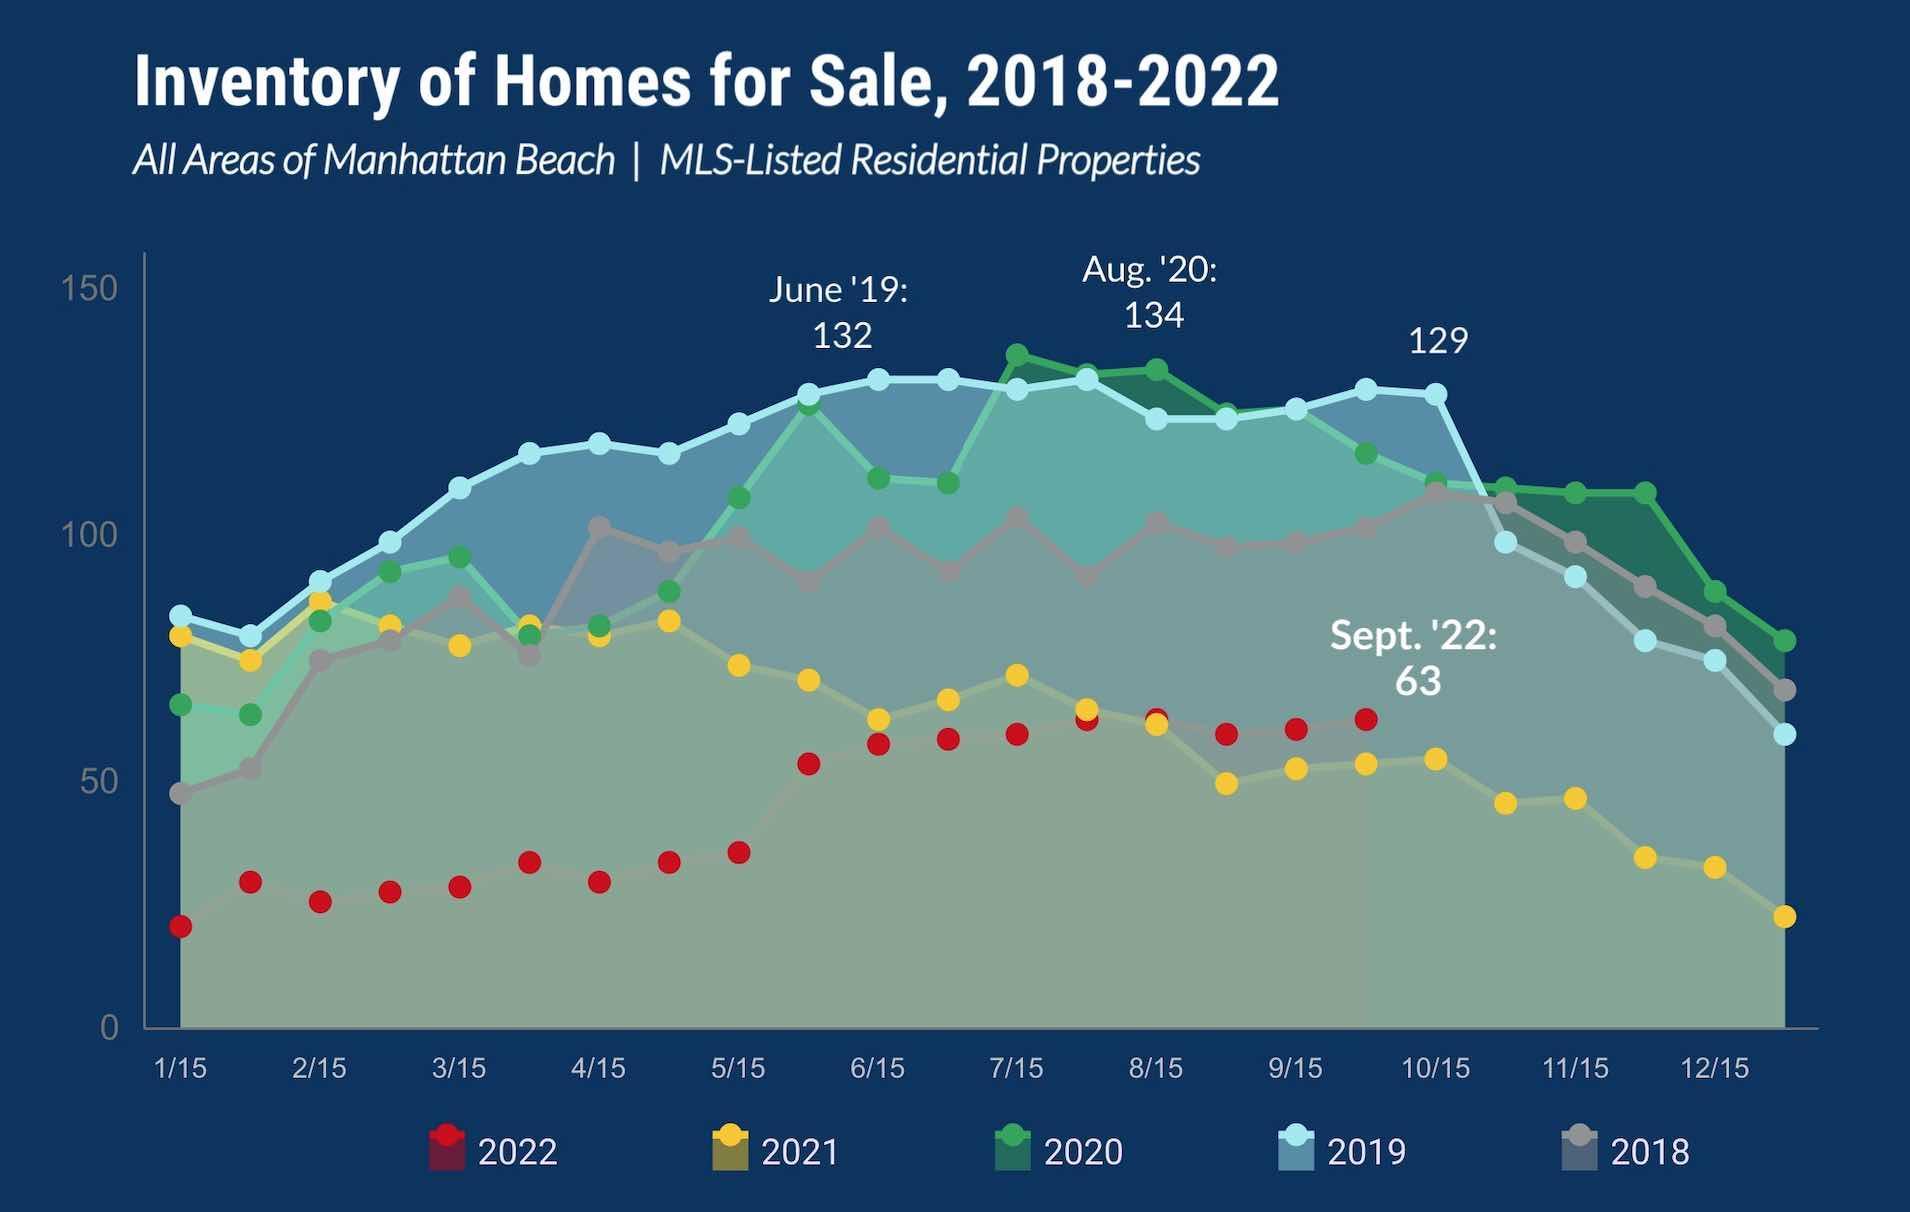 We've had a chronic shortage of homes for sale in Manhattan Beach for most of two years now.
The yellow and red dots on this chart show 2021-22. You'll see that only during Q3 did 2022 surpass 2021 in inventory levels, but it was still a pretty modest increase.
With 63 active listings as of Sept. 30, we were still 30-50 listings below the levels seen in the three prior years. Almost by definition, lower inventory should be contributing factor to the (lower) figures we will find for pending sales and closed sales.
Worth noting: Inventory for 2021-22 is near to, even a bit higher than, figures seen in 2013-15.
Keep in mind, we record active inventory twice per month in our custom-built MB Market Update spreadsheets, as we have done for many years. This figure does not necessarily tell you how many listings have come to market.
Pending Sales Were Slower
 If you think more transactions in the market is a sign of market strength, then you're not going to like this part of our Q3 report.
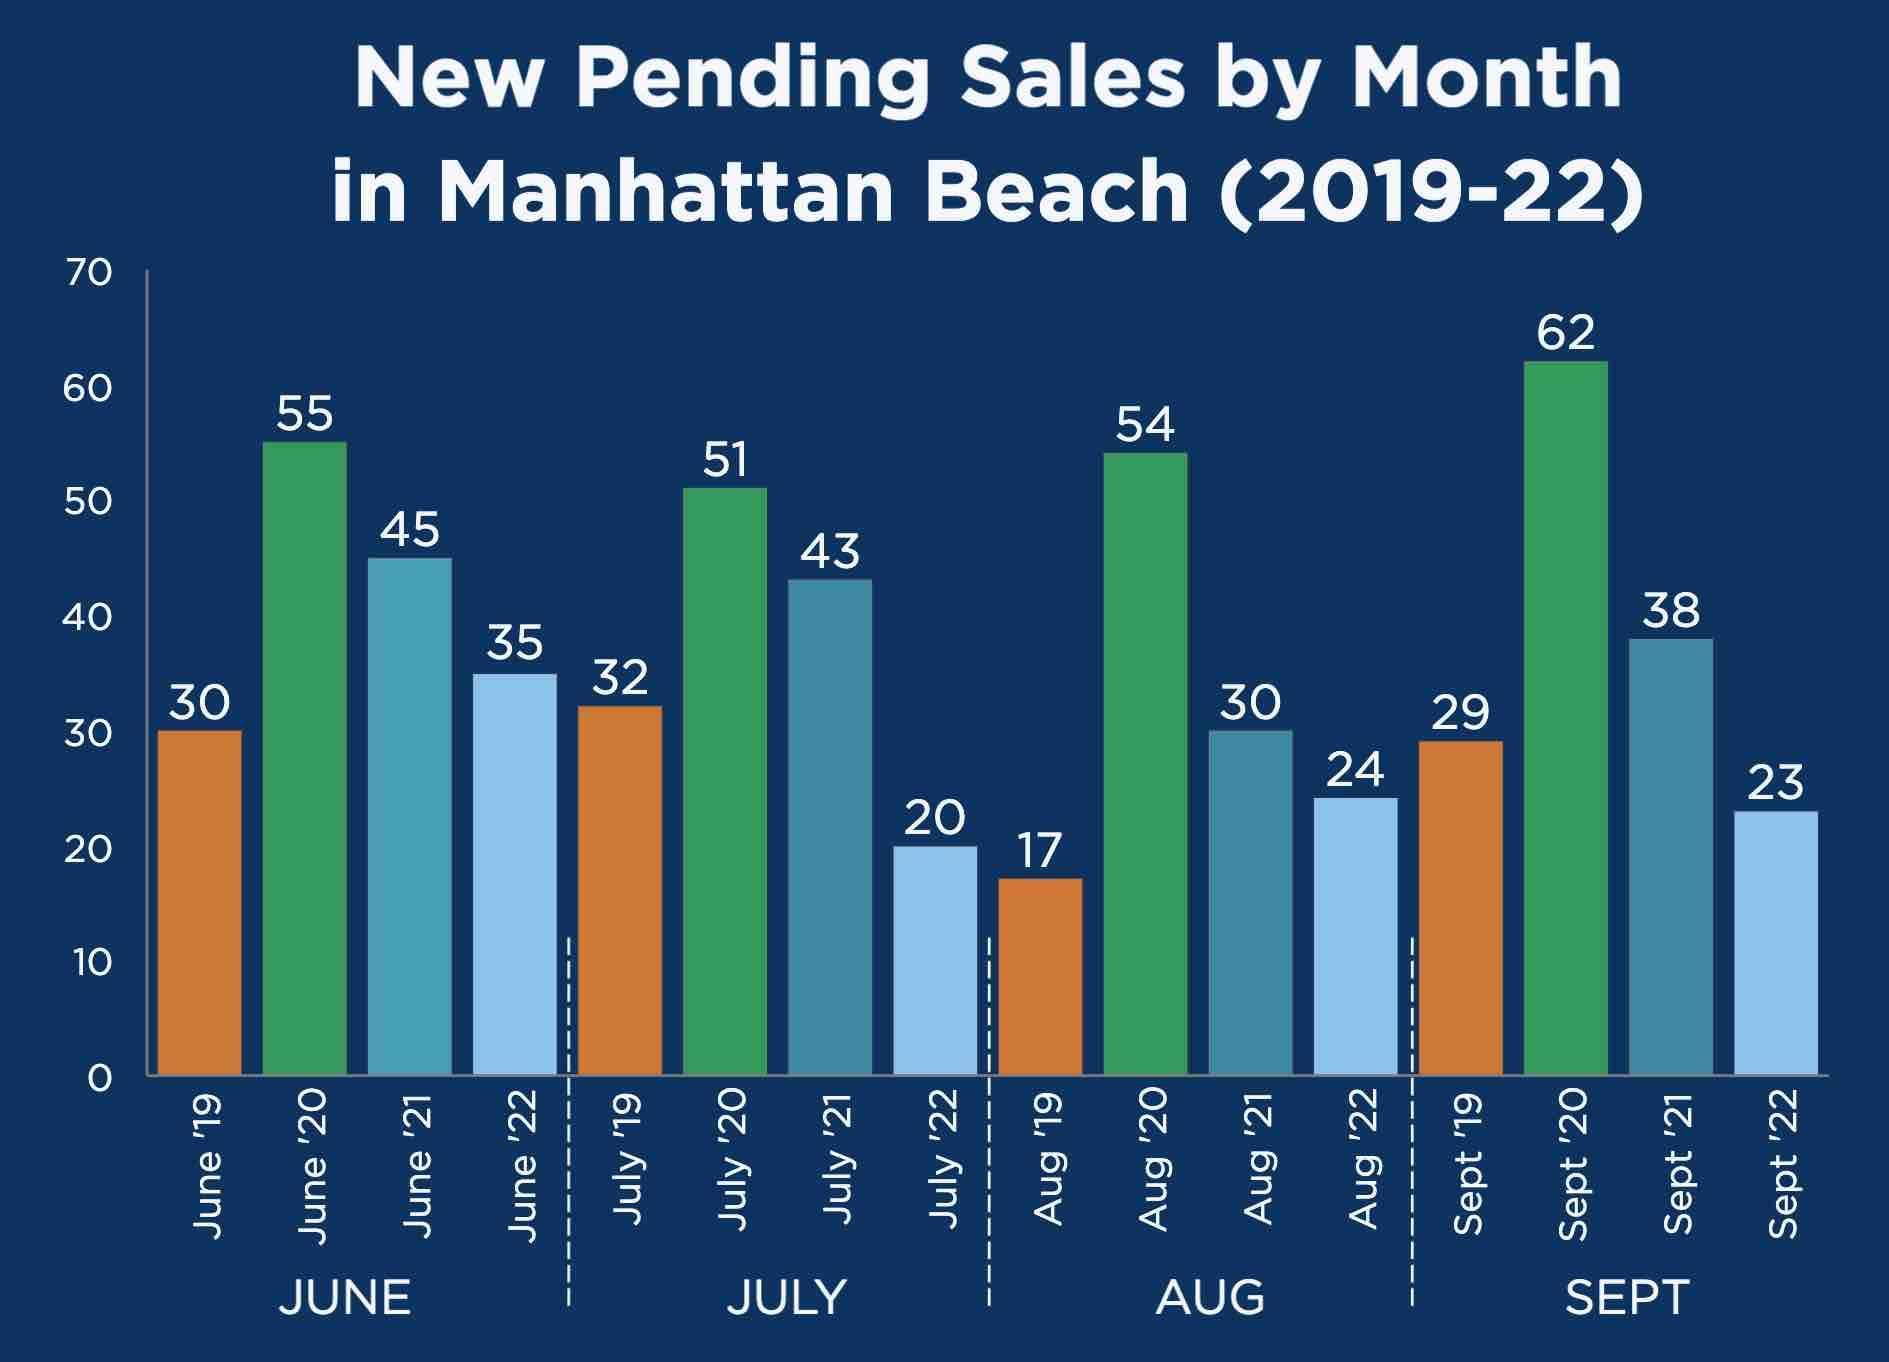
Recent months have been anemic.
Three out of the past 4 months have seen fewer new escrows begin in Manhattan Beach than in any of the prior 3 years.
The lone bright spot: Aug. 2022 bested Aug. 2019, with 24 new deals compared with a yucky 17 new escrows in 2019.
 Otherwise, you see pretty steep drops for each of these Summer (or Summer-adjacent) months, especially when looking at go-go 2020 and '21.
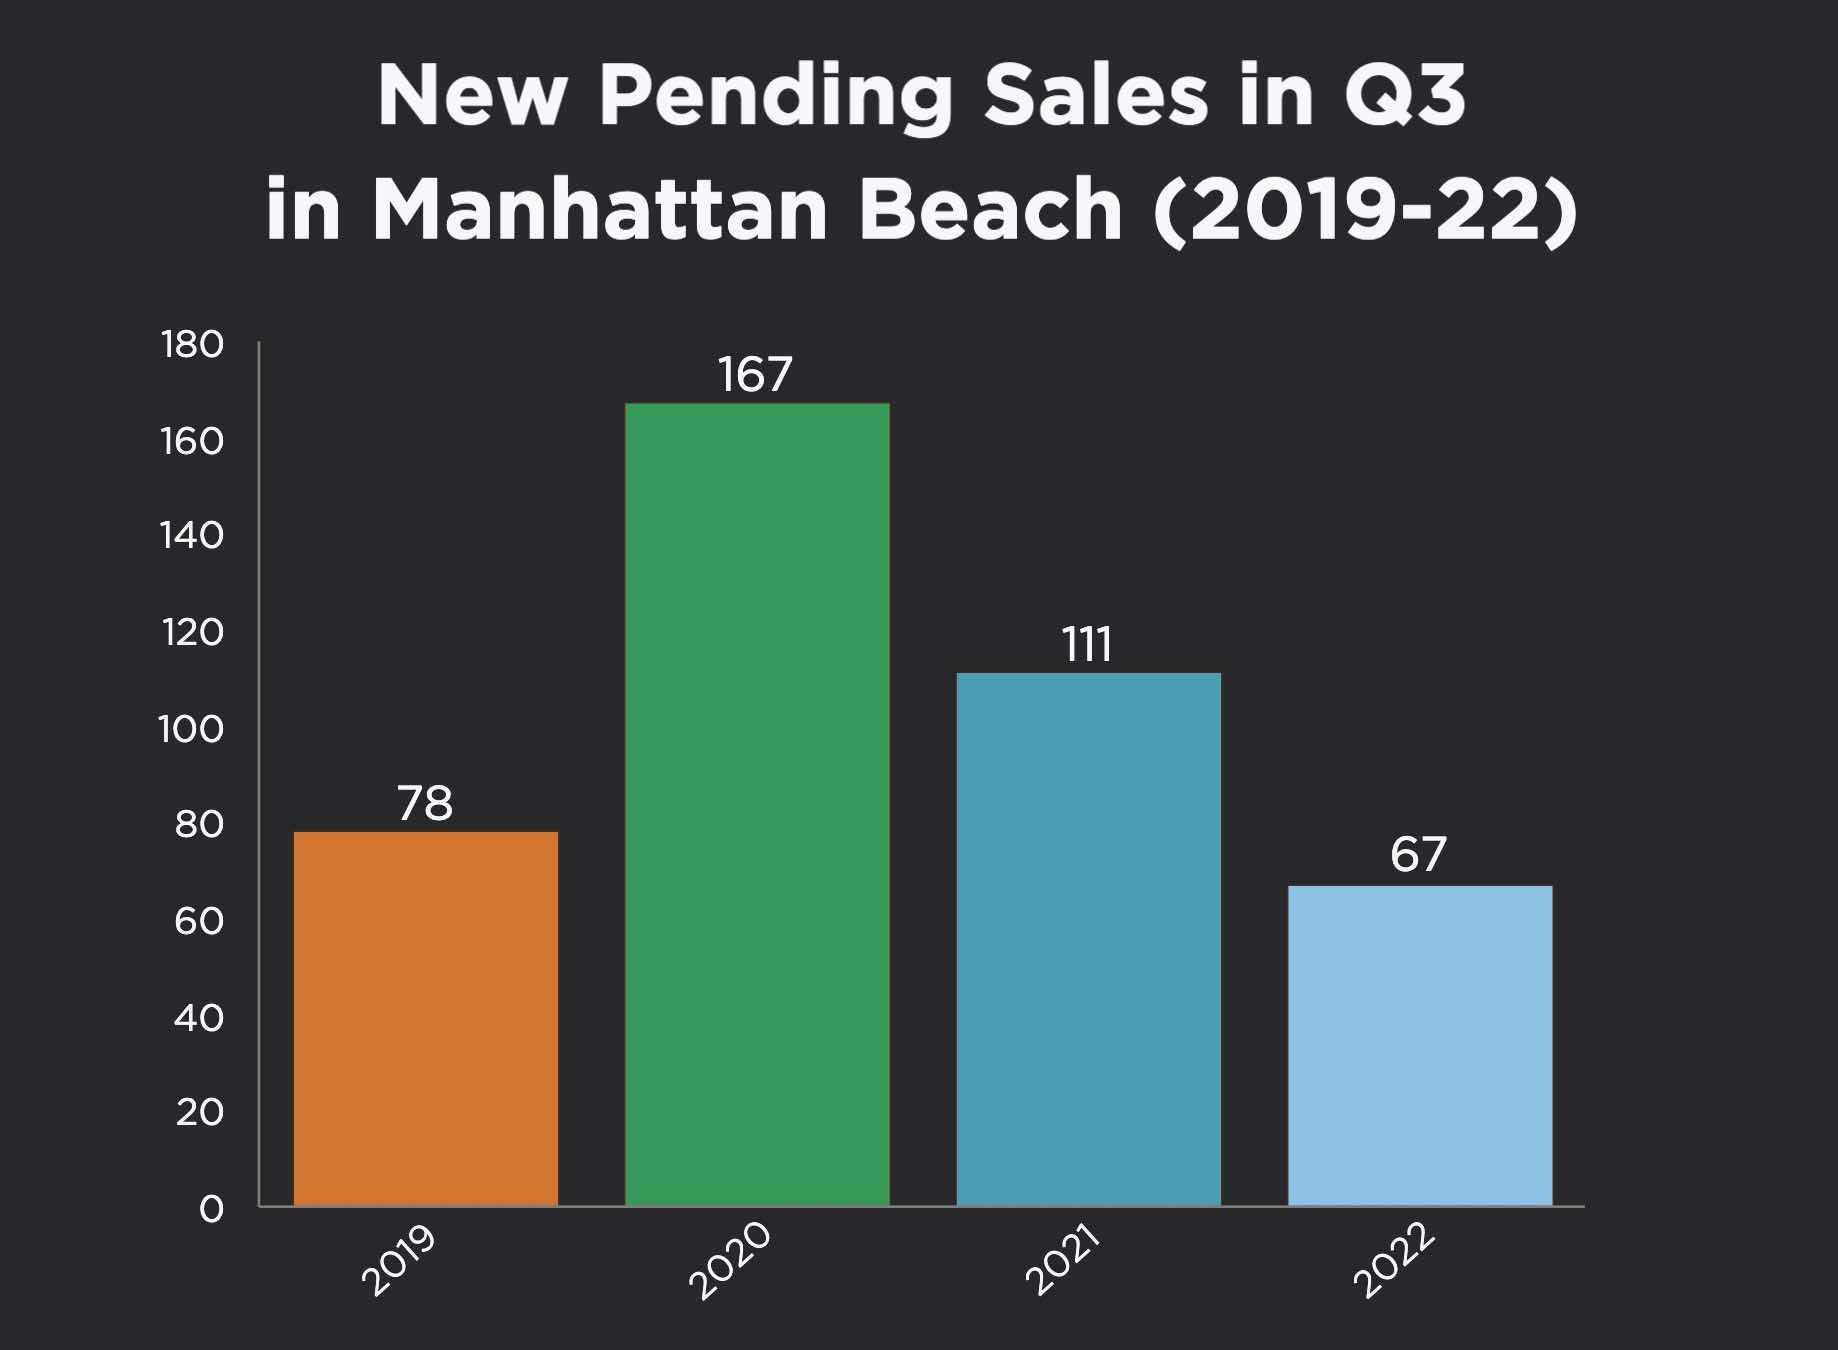
We isolated just the Q3 data (July-Sept.), and it underscores the scale of the dropoff.
Just 67 new deals were inked in Q3 this year, literally 100 fewer than in 2020.
True, it's always going to feel kind of unfair to compare some stats to 2020's. It's like this year is the D&D kid at home, feeling inferior to the older sister who just swam in the olympics.
Don't worry, little buddy. You've got strengths that even your big sister doesn't have. You just do you!
But seriously, things were a bit rough all Summer, as buyers froze up for a bit upon seeing new mortgage rate trends.
Those rates turned out not to be temporary. We'll see if the impact was.
Days on Market to Sell Was Very Low, and Flat
Now get ready for what'll seem like a contradiction.
 Weren't we just talking about an anemic sales pace?
Well, listings that sell are not hanging around at all.
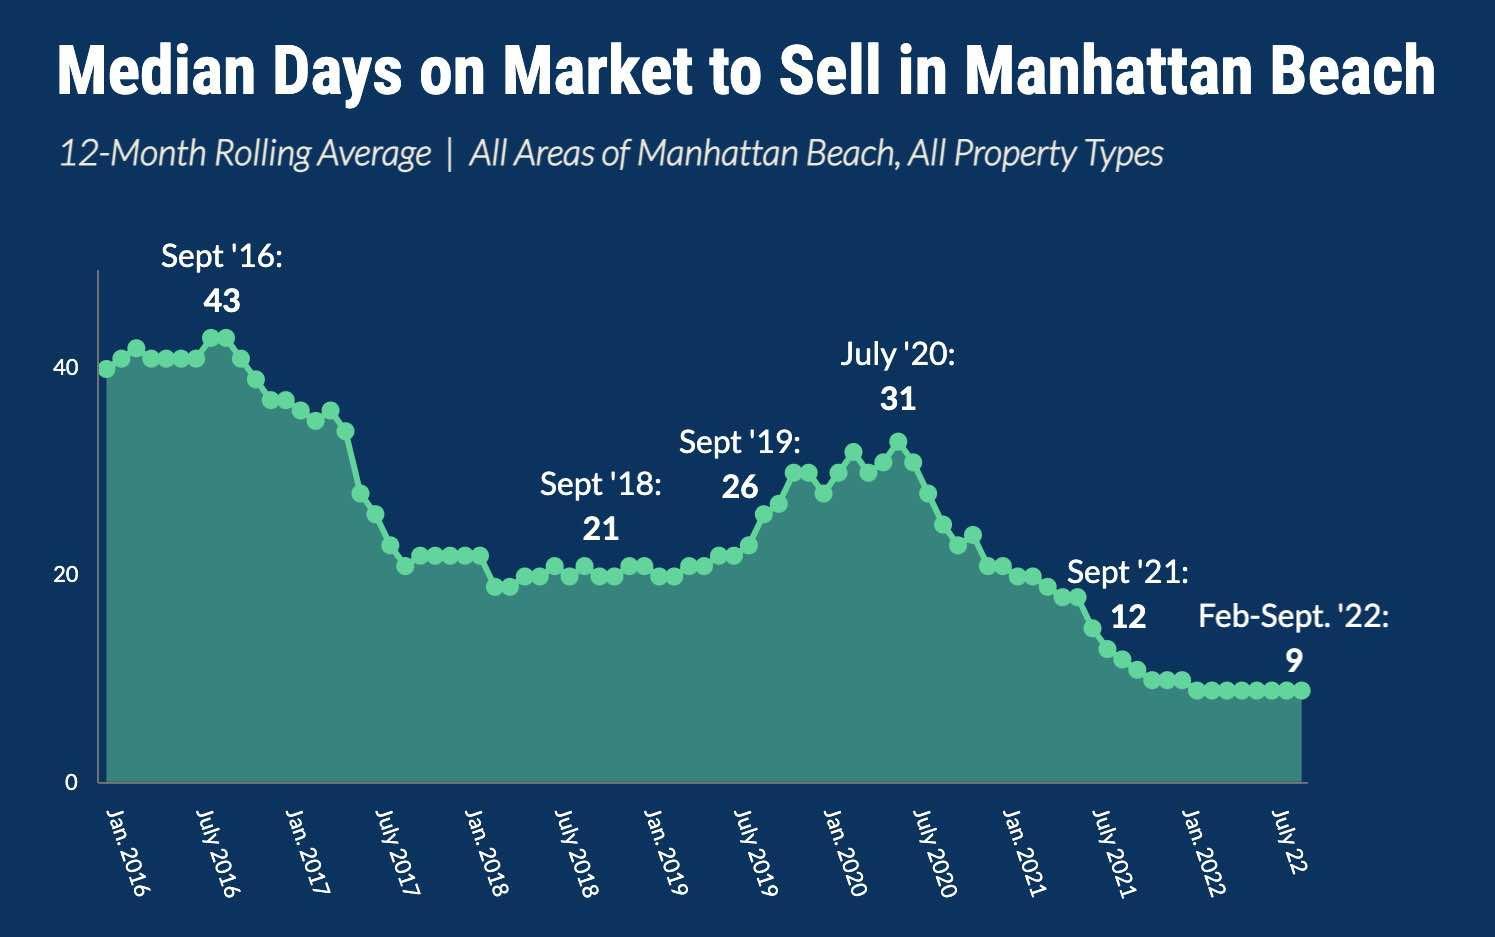
As part of a 2-year trend, median days on market has been stuck almost all year at just 9 days.
This is the number of days on market for listings that do find a buyer, to be clear. It's not an average, and it doesn't include listings that don't sell.
It's the median, meaning half the listings that sell need more than 9 days on market, and half of those selling need 9 or fewer.
It's hard to express how very, very low this is. The same median DOM measure was never under 30 between 2008-2017. We're at one-third that level.
You can probably read this quick selling pace for listings in line with the low, low inventory figures for the past couple years.
The demand is there. The listings aren't.
When options come out, they're absorbed quickly.
Months of Supply Still Low, But Kept Increasing
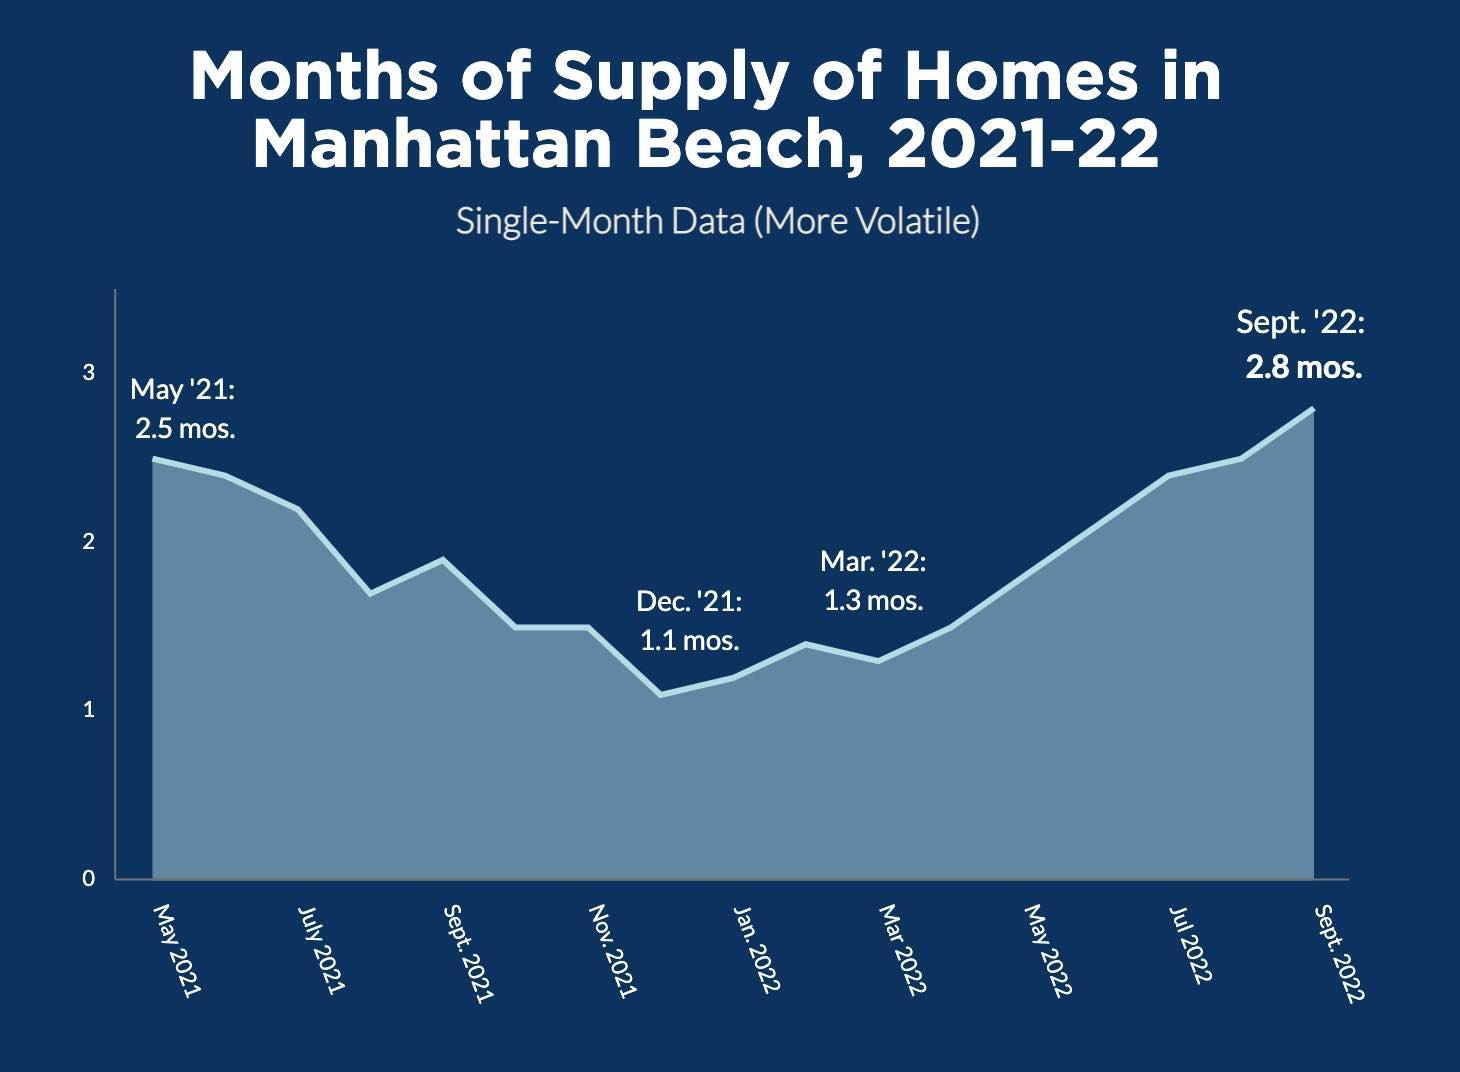 The year 2022 began with a remarkable bottoming-out in the measure known as "months of supply."
Ever since, that figure has been steadily rising.
"Months of supply" takes into account the pace and number of homes going into escrow, along with active inventory. The figure estimates how long it would take to sell every listing on the market.
Way, way down at 1.1 months in December, and at 1.3 months as the market got rolling in March, the figure had more than doubled to 2.8 months by the end of Q3.
 This first calculation uses the snapshot of a single month. But we also need to look at the figures in perspective.
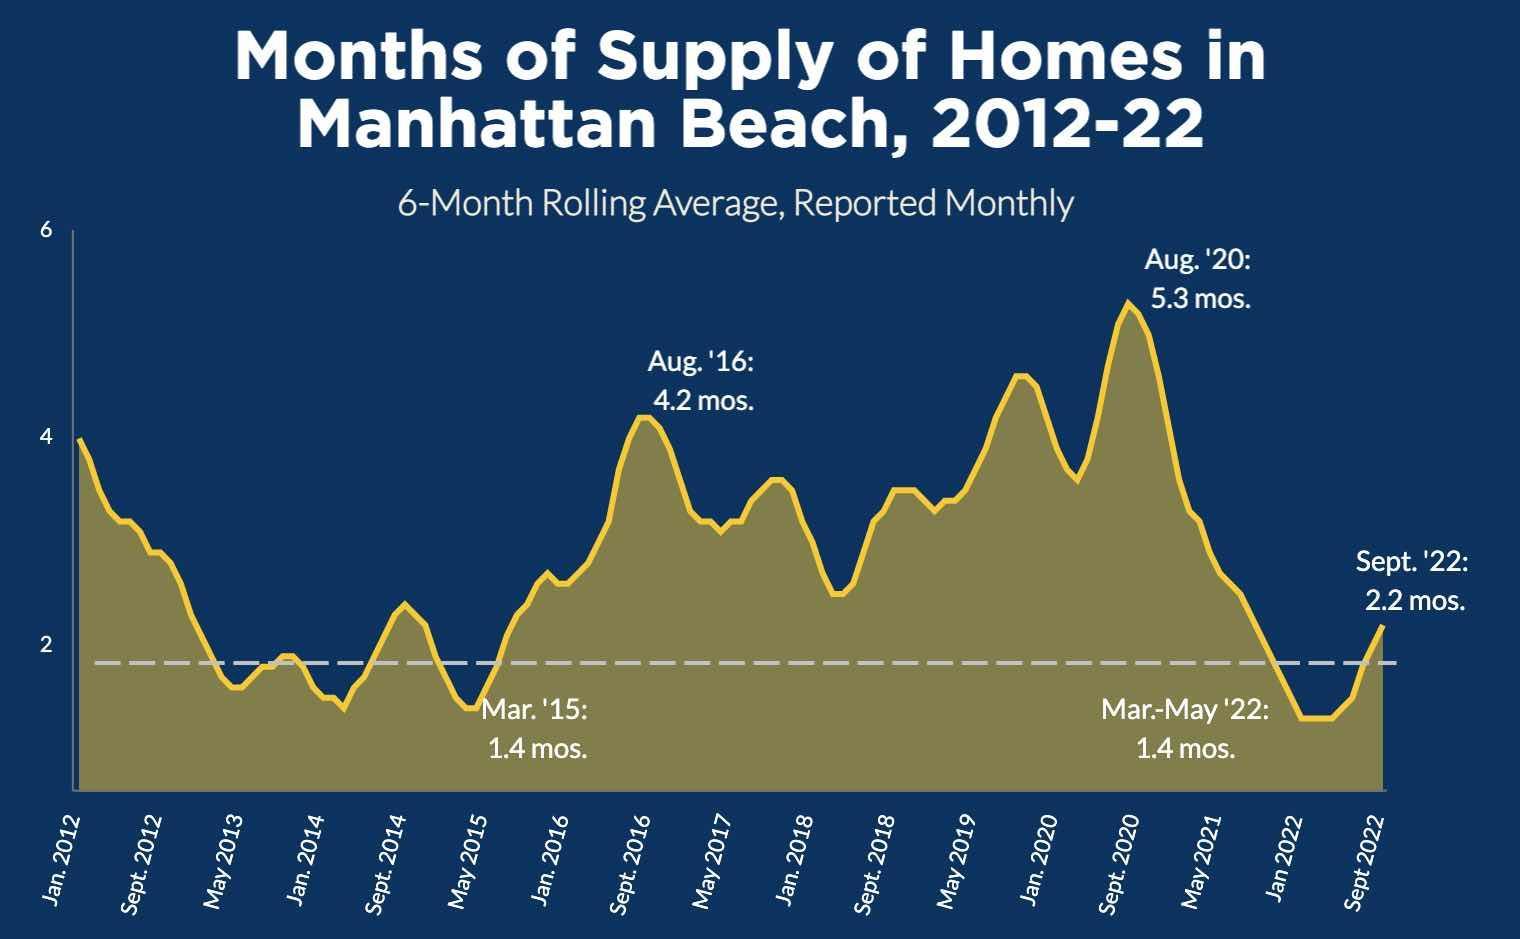
For our second chart, we smooth out the data with a 6-month rolling average. And here we also go back more than 10 years for a much wider view.
Now you see that the recent doubling of "months of supply" comes at the end of a virtual ski slope down from Summer 2020's very high 5.3 months. (Early covid shutdowns had frozen new escrows briefly, elevating the figure.)
The 6-month rolling average was at 2.2 months by the end of September.
We also drew a little line at 2 months to show how rarely the 6-month average for months of supply has ever been this low.
In the internet age, about 4 months of supply is taken to be a sign of a "buyers' market." We've hit that level most recently in Fall 2016, Fall 2019 and early in the covid pandemic. Only Fall 2019 actually resulted in a decrease in local home prices.
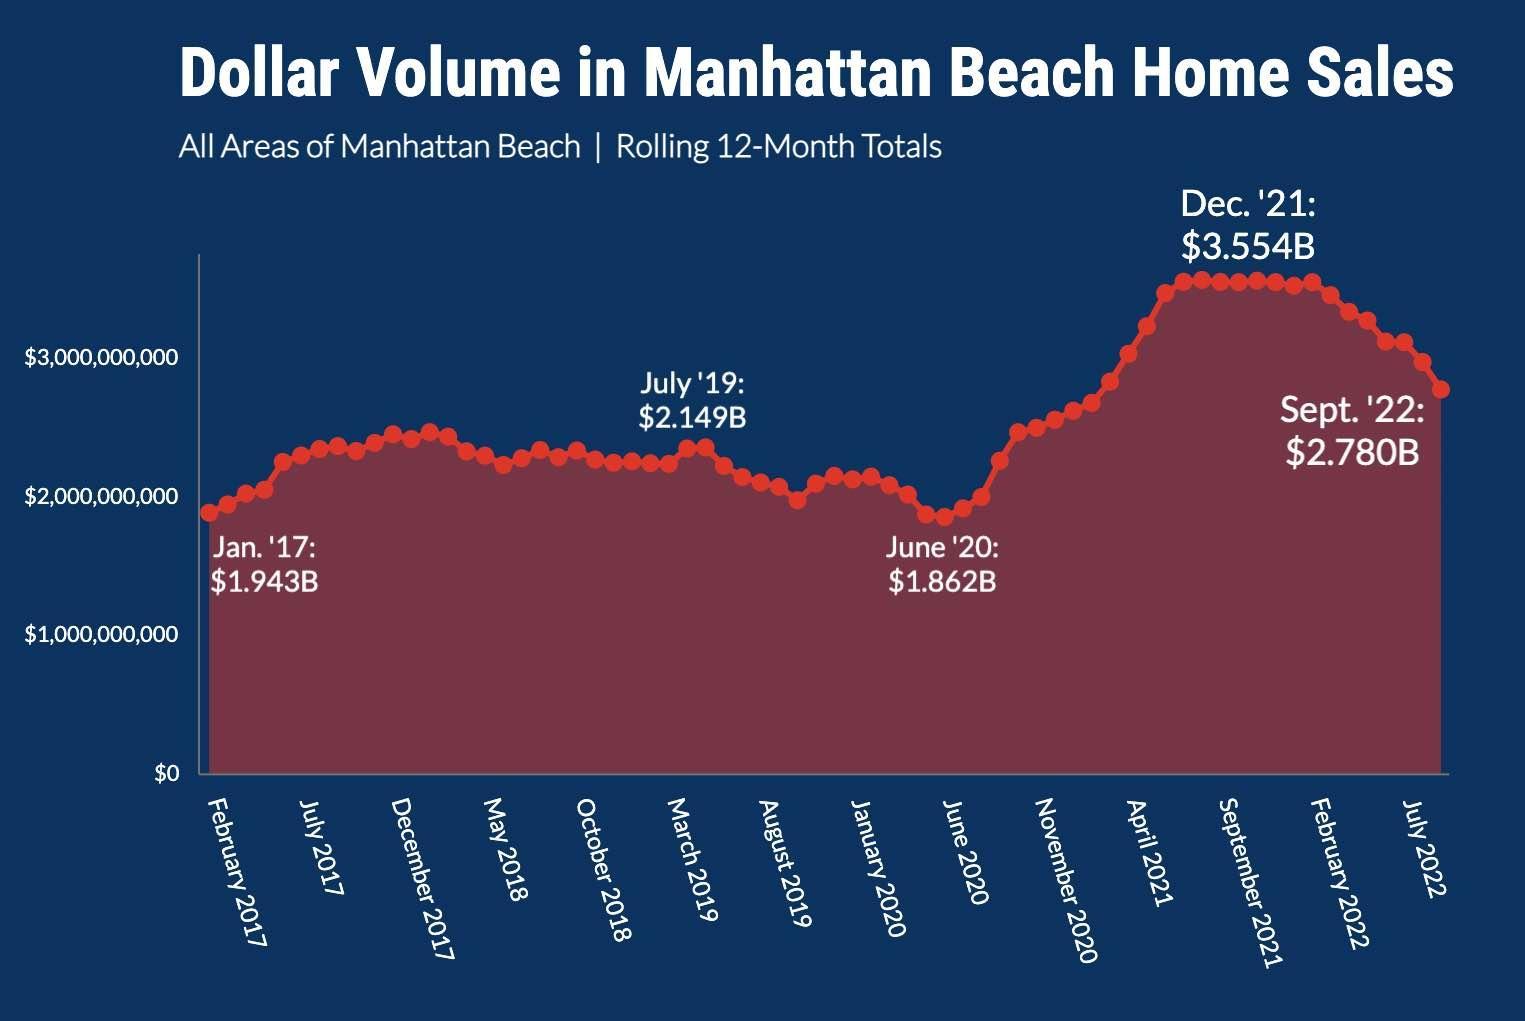
Dollar Volume of Homes Sold is Down Sharply
 Now back to some depressing news, particularly for your local realtors.
Everyone knew that the post-covid-shutdown home-buying frenzy would calm.
You'll see it clearly here in the huge drop in sales volume.
By the end of Q3 '22, the total value of all homes sold in Manhattan Beach within the prior 12 months was down to $2.780 billion.
It's a huge number!
It's greater than everything before early 2021.
But this is a steep drop of 24%, nearly $850 million, from the dollar volume recorded at the end of 2021.
Among other things, that's taken more than $35 million in potential real estate commissions off the table. So, please, hug your local broker if you can, and just remind him or her that times have been better, and they'll be better again.
------------------------------------
Nerdy notes:
Inventory and pending-sales data are compiled as part of MB Confidential's twice-monthly MB Market updates.
Most other data comes from the California Regional Multiple Listing Service, Inc., InfoSparks © 2022 ShowingTime.
All charts custom crafted by Dave Fratello for MB Confidential, and copyrighted.


