A relentless rise.
That's what's going on with Manhattan Beach home prices.
 You may hear about headwinds that the real estate market has run into, regionally and locally.
Sure, there are signs. We'll discuss.
But many people won't worry about the challenges in the market while prices continue rising.
…
A relentless rise.
That's what's going on with Manhattan Beach home prices.
 You may hear about headwinds that the real estate market has run into, regionally and locally.
Sure, there are signs. We'll discuss.
But many people won't worry about the challenges in the market while prices continue rising.
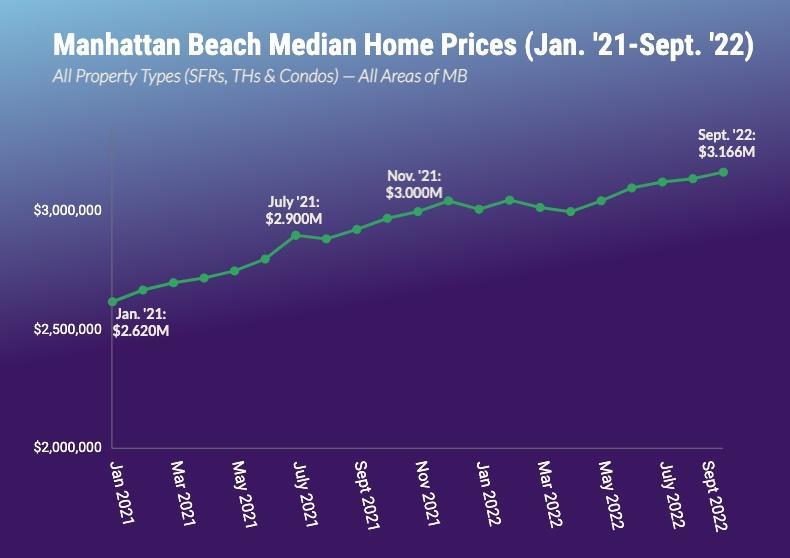
And rise they have. The citywide median price has hit yet another high as of Q3 2022.
The median home price for Manhattan Beach for the 12 months up to Sept. 30, 2022: $3,166,500.
That's a jump of 21% just since the first day of 2021. You know, after bonkers 2020.
We noted also that some regions of Manhattan Beach are hitting new highs.
The median price for the Tree Section: $3.325M.
And for the Sand Section: $3.967M, just a hair short of $4M.
To be fair, both of these figures, while calculated from a year's worth of data, are still based on fewer than 150 sales. They'll be a bit more volatile due to the low sample size. But it's still something to see.
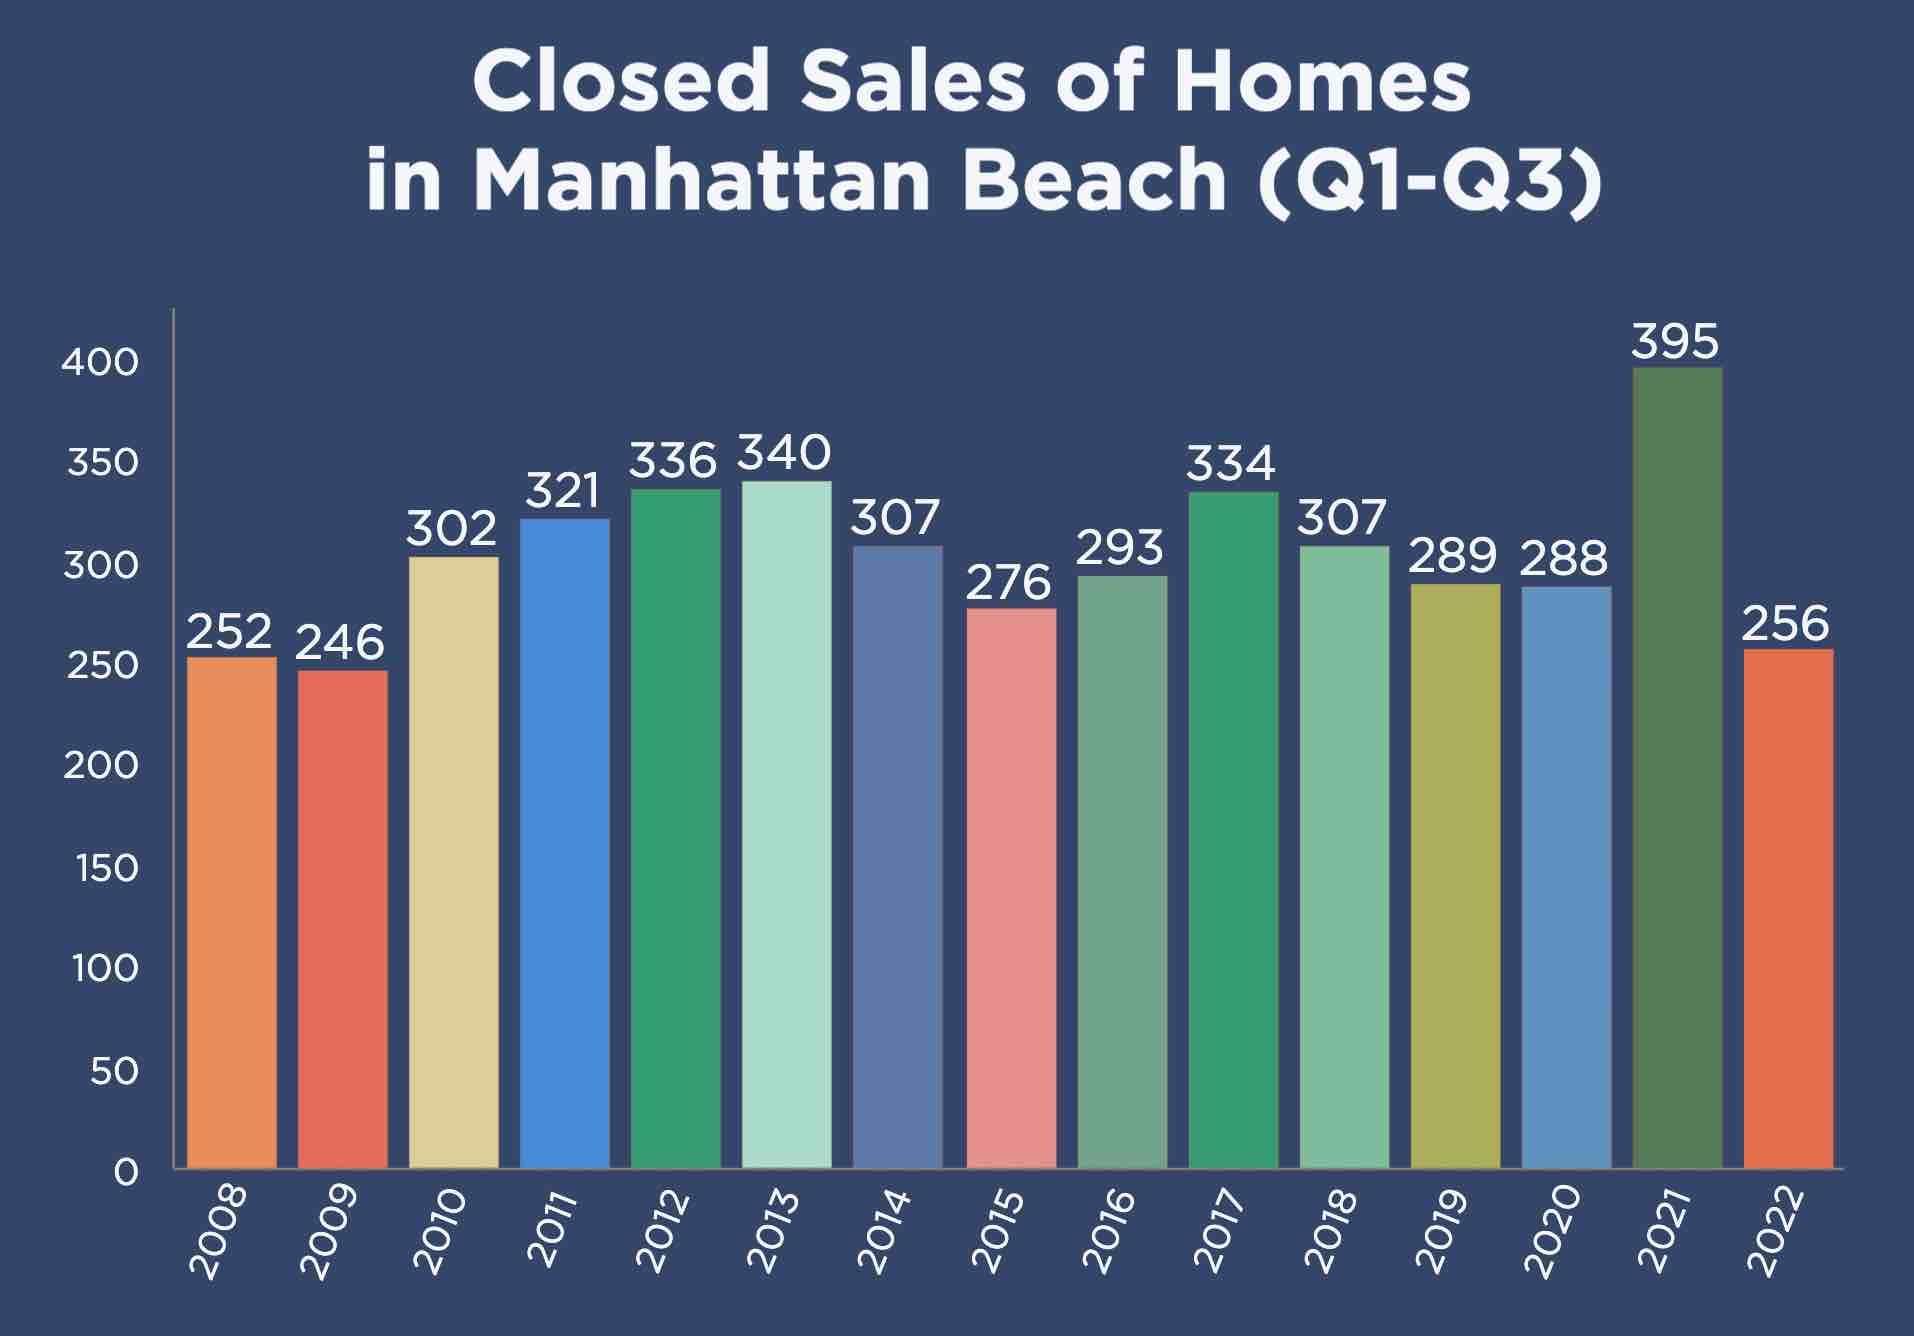
Oh and speaking of smaller sample sizes, here's an update on sales totals.
 This won't be a surprise if you've been tracking our recent updates, but still.
We now see the weakest year for total home sales in Manhattan Beach since -- ugh, what's that?!? -- since 2009!
If you're a real estate statistic, you really don't want to be compared with a stat from 2009.
Would you like to take a trip back through time? You can review an MBC post from this time in Oct. 2009 when we were right here dissecting the drastic fall in median prices. (See "Median Movement, 2007-09.")
So, while both inventory and sales may be down this year, at least we don't have that problem to wrestle with right now.
We'll keep looking at stats from Q3 over the next several days.
Here's the rest of our local real estate market update report for the period ending 9/30/22:
> 63 active listings as of 9/30/22 (+2 from 9/15/22)
> 53 SFRs (+1)
> 10 THs (+1)
See the Inventory list as of 9/30/22 here, or see the MB Dashboard for up-to-the-minute data.
Active listings by region of Manhattan Beach in this report:
> Tree Section: 8 actives (flat)
> Sand Section: 27 actives (+3)
> Hill Section: 12 actives (-4)
> East MB: 16 (+3)
We're also providing a report on closed sales by region of MB
Sales data, including PPSF for all properties, are organized by sub-region of Manhattan Beach.
Here's a link to the spreadsheet: "MB Pending/Sold as of 9/30/22".
Please see our blog disclaimer.
Listings presented above are supplied via the MLS and are brokered by a variety of agents and firms, not Dave Fratello or Edge Real Estate Agency, unless so stated with the listing. Images and links to properties above lead to a full MLS display of information, including home details, lot size, all photos, and listing broker and agent information and contact information.

 You may hear about headwinds that the real estate market has run into, regionally and locally.
 This won't be a surprise if you've been tracking our recent updates, but still.