There's not yet a unified theory (or even hypothesis) as to why, exactly, Manhattan Beach real estate inventory has been growing so noticeably this year.
One logical place to look for answers is in the question: How many homes are actually selling?
If we've got the mathematical formula correct here, fewer…
There's not yet a unified theory (or even hypothesis) as to why, exactly, Manhattan Beach real estate inventory has been growing so noticeably this year.
One logical place to look for answers is in the question: How many homes are actually selling?
If we've got the mathematical formula correct here, fewer sales would mean that more homes would remain on the market at any given time. (Does that sound right?)
And, lo, the data do show that the pace of sales in Manhattan Beach has slowed.
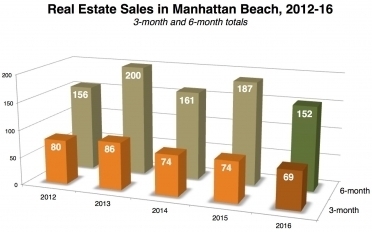
We looked at MLS-reported closed sales for two different stretches of time: Jan. 1-March 31 of each year (2012-2016), and Oct. 1 (prior year)-March 31 (current year).
Looking at the first quarter or Q4+Q1, the data show the same thing: The just-concluded Q1 of 2016 was, modestly, the slowest of the past 5 years.
The total number of closed sales for the first part of this year, 2016, was 69. That's not too far off of the 74 sales seen in each of the two prior years (-7%).
If we compare against 2012, roughly speaking the first year of the recent rally in prices and the frenzied pace of the past few years, sales this quarter were actually 14% lower.
Comparing the 6-month sales totals shows less difference. Though the 152 sales from Oct. 2015-March 2016 is the lowest on our chart, it's down only 4 from the 2011-12 period, and down only 9 from the middle year, 2014.
We are down 19% in sales year-over-year, however, by this 6-month measure.
Truthfully, these are small numbers, so we don't want to overstate the meaning of rates of change. But the bottom line is still that there were fewer sales.
Now, these changes in the sales pace have only an uncertain relationship to the inventory levels.
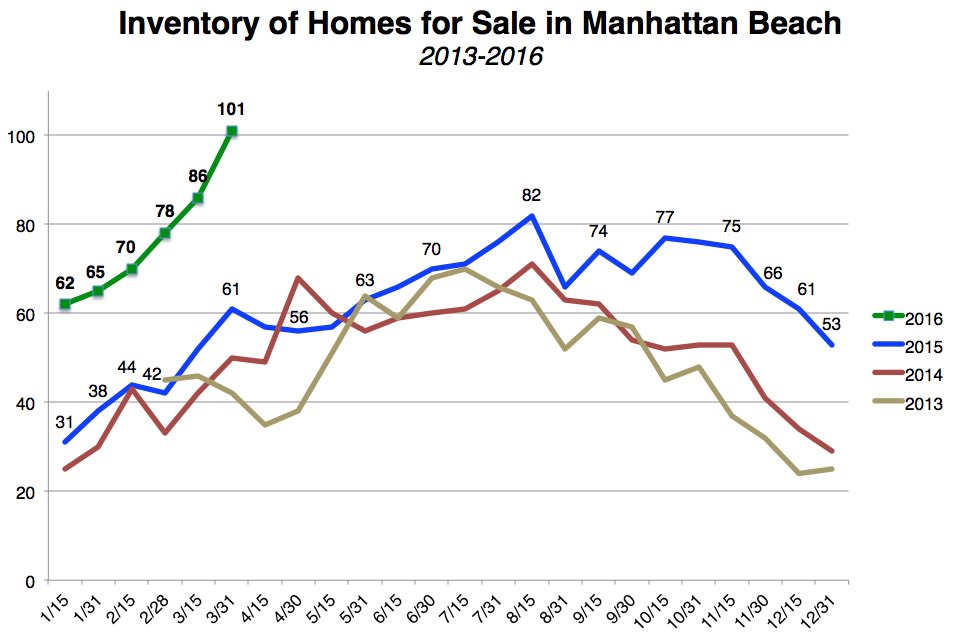 Just look back at our chart from last week.
With inventory this year now running 30-40 listings higher than last year, the explanation does not come from seeing 5 fewer sales than last Spring.
You might have a better case in arguing that 35 fewer sales from October to the present helps explain the inventory bulge.
In fact that could be the whole story, but the hitch that prevents us from adopting that explanation is that inventory tends to look very different at the end of the year and in the first part of a new year.
The 6-month data period includes the story of the waning days of one season and the start of another.
We'll mark this as a contributing factor. Modestly slower sales pace, combined with higher inventory, means somewhat higher inventory.
While mortgage rates are still good, and buyers have some choices and some leverage, if there's going to be a time that buyers view as favorable, right now actually looks pretty good. We'll see if that data bear out that feeling by mid- to late-2016.
Please see our blog disclaimer.
Listings presented above are supplied via the MLS and are brokered by a variety of agents and firms, not Dave Fratello or Edge Real Estate Agency, unless so stated with the listing. Images and links to properties above lead to a full MLS display of information, including home details, lot size, all photos, and listing broker and agent information and contact information.


