SFR inventory is down this year, but the time required to sell a property is up substantially.
That's one finding from a new analysis of DOM data drawn from MBC's tracking spreadsheets.
We looked at SFR closings from the 6 months spanning the Spring and Summer selling seasons in 2008-2009, basically May-October each…
SFR inventory is down this year, but the time required to sell a property is up substantially.
That's one finding from a new analysis of DOM data drawn from MBC's tracking spreadsheets.
We looked at SFR
closings from the 6 months spanning the Spring and Summer selling seasons in 2008-2009, basically May-October each year with a little late-April action included.
DOM reported here come from MBC's "True DOM" figure for each property, counting forward from the date a property hit the market till we noted that an escrow had posted. DOM-resetting re-lists would have no effect here.
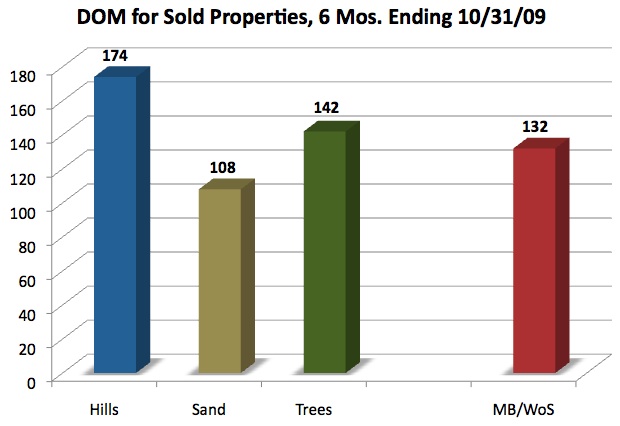
Looking first at 2009
(click chart to enlarge), the Hill Section's closed-sale DOM figure is a semi-astronomical
174 for 2 reasons. First, of course, sales volume is always pretty low in the Hills. There were 12 closed sales in this limited time span that came into this analysis. (Click here for the
Hill Section Solds page from MBC's online spreadsheets.)
Second, and related, with lower volume, a few very longtime listings pushed the average high. The capper was new construction at 218 N. Dianthus at 496 DOM.
The Sand Section had the lightest DOM for sold properties at
108. That's below the average for all areas west of Sepulveda (
132), but up substantially from 2008 for this sub-region, as we'll see below. Sales volume was 42 closed sales in this analysis. (Click here for the
Sand Section Solds page from MBC's online spreadsheets.)
The Tree Section had the greatest sales volume at 50 sales, but a high DOM figure at
142, a tick above the average of all 3 areas. (Click here for the
Tree Section Solds page.)
Now, 2 quick caveats before we go further. First, for both 2008 and 2009, we did not have clear DOM data for a few properties, so they were dropped out of the analysis. The effect should be a wash.
Second, while our DOM figures will vary substantially from other MLS-based analyses for a good reason – re-lists don't work here – the DOM figures were compiled by hand, and may be off by a few days for any given property. Given the vagaries of what "days on market" means to many different people, we think giving or taking a few days here and there has no real impact on the data or analysis.
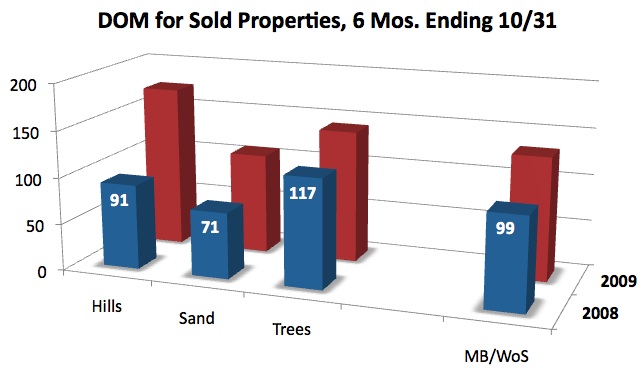
As we compare 2009 to last year
(click chart to enlarge), the first issue to note – not on the chart – is that sales volume was better this year, with
104 closings in this data set, compared to
94 in the time span last year.
However, across the board, DOM for closed sales was a lot higher in 2009.
The fact that Hill Section DOM nearly doubled from 91 to 174 is, again, an artifact of limited sales volume, but a bit striking nonetheless.
Beach-close properties have suffered the most in 2009, with those lucky enough to sell needing 52% more market exposure – 71 DOM last year to 108 today.
The Tree Section was the busiest both years, with 52 sales in 2008 and 50 in 2009, but DOM rose 25 days, or 21%, for those homes that got a deal done.
Overall, SFRs west of Sepulveda needed an extra month to sell this year – 33 extra days, or a 33.3% increase.
That's how Spring and Summer wound up. Now here come the holidays.
Please see our blog disclaimer.
Listings presented above are supplied via the MLS and are brokered by a variety of agents and firms, not Dave Fratello or Edge Real Estate Agency, unless so stated with the listing. Images and links to properties above lead to a full MLS display of information, including home details, lot size, all photos, and listing broker and agent information and contact information.