It was the worst of times, it was the best of times.
 In September and October 2008, the Great Recession kicked into full gear, as stocks nosedived, unemployment peaked, Fannie & Freddie were taken over and the first desperate big bank bailouts began. Everyone lost money and began to fear the future.
And man, oh man, was it ever a terrific time to buy Manhattan Beach real estate. If you could.
Of course, that second part is only really clear now. Because not only has there been a housing recovery nationwide, from which MB has benefited. Also, in these recovery years, MB seems to have begun to glow much more brightly on the map. It's now a destination. A smart place to invest. A market that's drawing more top-tier buyers than ever before. That's pushing prices even higher.
So how well have prices bounced back since the depths of the Great Recession?
We dove into MLS data to look for evidence.
 We'll look at the full-year period from Sept. 1, 2008-Aug. 31, 2009 as the recession year. That was pretty much the scariest time in the real world and, not coincidentally, the last full year when prices were dropping in MB. In several past posts here at MBC, we've identified Q3 2009 as the end of the drop, with Q4 2009 beginning the stabilization of our local real estate market and the eventual bounceback.
For comparison, we're looking at data from Sept. 1, 2013-Aug. 31, 2014 as the current year. If prices have risen within this past year (as many would argue that they have), this effect will be smoothed out in the data.
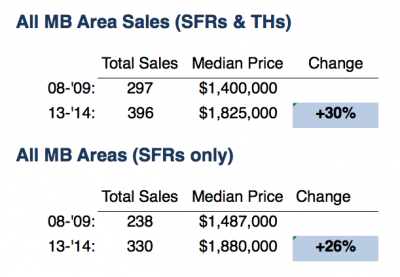
 We see more than one-third more sales in the current period. Yes, housing was bottoming and everything was scary, but there were still 300 sales citywide in the 2008-2009 period. Someone was buying. Now, there are more buyers – even as prices rocket up.
Citywide, if we include townhomes and condos in addition to SFRs, the median price is up 30%. If we narrow the data to SFRs only, the jump is a bit less, 26%.
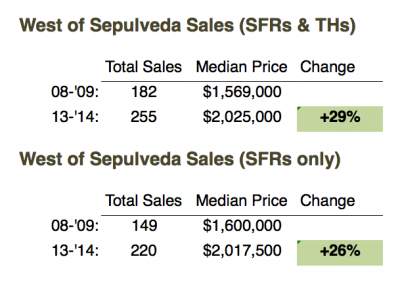
The percentages are a near match when looking only at west of Sepulveda housing. Include townhomes, and the jump is 29%, and with SFRs only, it's 26%. (Take note, though – the median price for everything west of Sepulveda is now over $2.0M. That's kinda huge.)
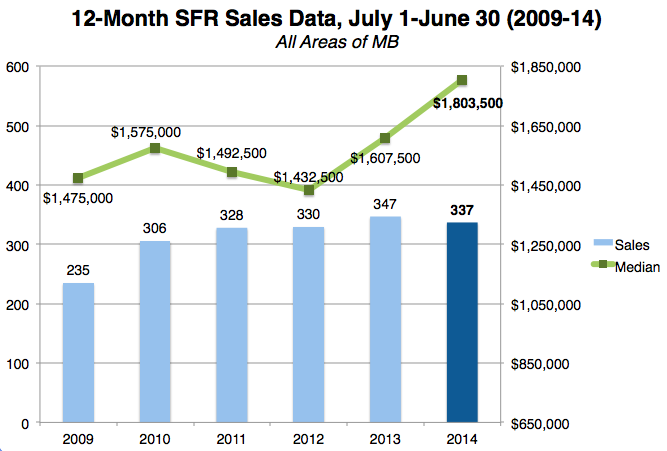 These numbers are consistent with, but even higher than, the broader trend data we looked at midyear here at MBC. Right as June 30 passed, we looked at the 1-year periods dating back to 2009 and examined sales totals and median prices for SFRs. (See "MB Median Prices Tilt Way Up.")
What's that you're saying?
You say 30% or so doesn't seem like a big enough jump, compared to what your own eyes have seen?
Yeah, we had the same reaction here. Median prices do seem to often fail to tell the tale.
We need to look at some paired sales for more color.
 512 12th (3br/3ba, 2300 sq. ft.) is one that hit our radar in June this year. It's a unique remodel right near downtown with the very nice feature of a large back deck for true indoor/outdoor living off the common areas upstairs.
The 1950s original was rebuilt completely in 2007 to add square footage and create that deck.
In July 2009, 512 12th sold for $1.605M. This year, it got bid up from an asking price of $2.100M all the way to $2.357M.
In a post in June this year, we called that a "monster markup of $752K over the 2009 price, a 47% shot skyward."
You could almost call that 50% on a home that really wasn't changed much (new carpet, custom paint, etc.).
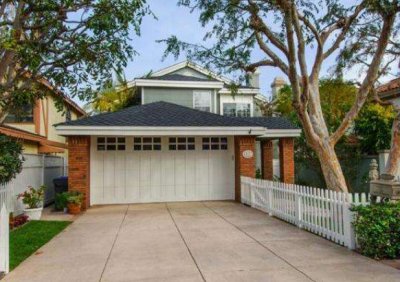 Similarly, a nicely remodeled 80s house at 3314 Laurel (4br/3ba, 3335 sq. ft.) sold for $1.610M in March 2009, and resold this June for $2.310M, a jump of 43%.
That home showed very well this year, but as we look back at the 2009 listing photos, it appears that most of the heavy remodeling work that sparkled this year was actually done before the '09 sale.
One sale that can't be used precisely, but is an interesting reference point, is 2300 Laurel (3br/3ba, 2000 sq. ft.), one of Dave's most recent listings to sell. The prior owners had purchased a downtrodden, smallish cottage on the site back in June 2009 for $1.160M.
Way-back-when, MBC speculated that it was a lot sale at $1.1M or so, but instead, the new owners saved the home, taking it down to studs, remodeling and making it something special. (It recently sold for $2.425M in that renewed condition.)
We'll just look at land value here. If the same lot became available today, based on other recent sales, we'd expect it to sell for $1.900M or so. If we're right, that's a 64% rise over time over the presumed land value in 2009.
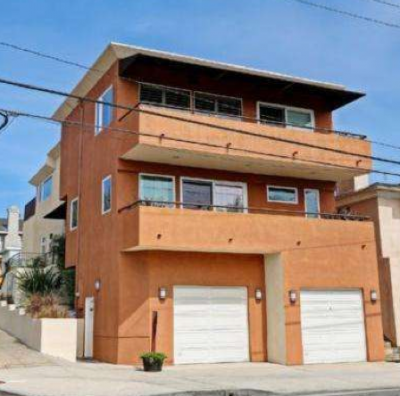
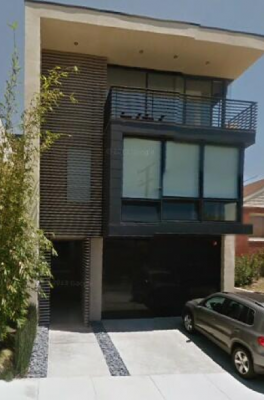 The last paired sale to look at is an off-market sale at 1208 Fisher Ave. (4br/4ba, 4450 sq. ft.), an enormous and flashy modern home that was built for the spec market (and launched at a most unfortunate time).
This one sold new in June 2009 for $3.650M.
Just a few weeks ago, in mid-August, it resold (off-market) for $5.700M.
That's a huge jump of 56% from then to now.
So, to recap, some of these same-home sales indicate very different values from 2009 to 2014:
All of those percentages are quite a bit above the jumps seen in median price data.
So if you want to know how far the market has moved since those deeply depressing (and opportune!) days, you have to pick your measuring stick: Broad, overall medians, or same-house sales... big data versus anecdote.
They're both valid in their own ways, but the market is driven by current sales comps, more akin to the same-house sales/anecdotal approach seen here in the second half of our post.
By that measure, it's not crazy to say MB is up about 50% since the financial world went bust.
-----------------
UPDATE: This post came down for a couple hours to fix an unfortunate math error, fortunately caught by an alert reader. Thanks!


