The news that SFR inventory is again approaching 100 after a moderate period this year prompted us to look back at the last several months.

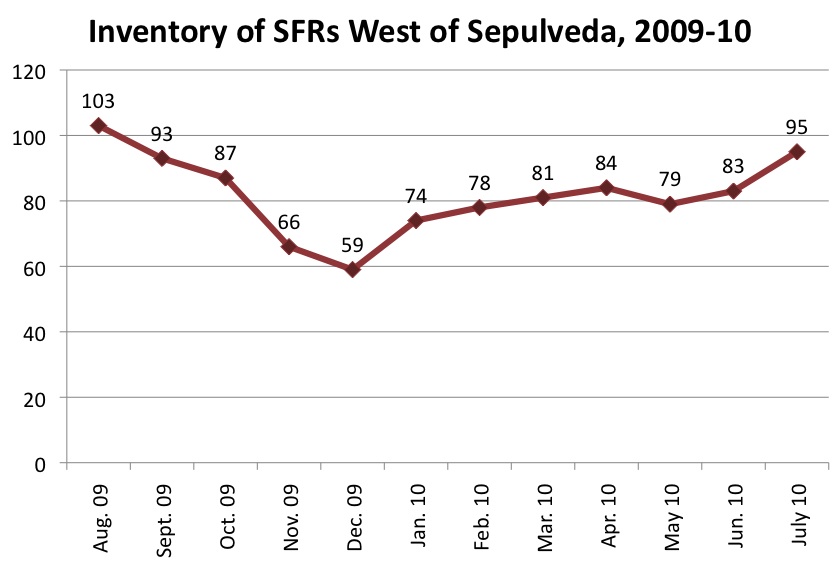
This graph shows inventory at month's end for each month in the past year, dating back to last August, when we were at 103. We were at 95 as of July 31.
If August 2010 looks…
The news that SFR inventory is again approaching 100 after a moderate period this year prompted us to look back at the last several months.
This graph shows inventory at month's end for each month in the past year, dating back to last August, when we were at 103. We were at 95 as of July 31.
If August 2010 looks like July 2010, with quite a few more new listings than sales, we may meet or exceed last year's end-of-Summer total in a few weeks.
Keep in mind, these data come from MBC's independent market tracking, looking at SFRs west of Sepulveda only. An MLS search may produce slightly different data, but these numbers won't vary much and are useful for spotting trends regardless. (Note: Our July 2009 spreadsheets were out of whack, so we aren't tracking inventory trends further back than Aug. 2009.)
What's the same this year? There always seems to be some growth in inventory through the Summer. (We'll look at the data for the past few years and report back.) People are on vacation, and often the only buyers with an urgency issue are those trying to lock into the school district. With classes beginning Sept. 1 this year, that demand surge – if it existed this year – may be finished.
What's different this year? Some new listings are surely coming from sellers who got the signal earlier this year that the market was more or less "back." It's a good time to sell, buyers are out there, well-priced listings are going, there are bidding wars here and there... that was the buzz in Spring, and it takes a while to translate that to putting your house up on public offer.
Looking at that graph, you see a steady decline in inventory in the 3rd and 4th quarters of 2009, a period which we now know marked a turning point – the start of a rebound of sorts that carried through this year's busy Spring. (Yes, we still need to graph that as well.)
Where will economic and real estate market sentiment be heading into the Q3 and Q4 this year?
Please see our blog disclaimer.
Listings presented above are supplied via the MLS and are brokered by a variety of agents and firms, not Dave Fratello or Edge Real Estate Agency, unless so stated with the listing. Images and links to properties above lead to a full MLS display of information, including home details, lot size, all photos, and listing broker and agent information and contact information.
Based on information from California Regional Multiple Listing Service, Inc. as of May 3rd, 2024 at 1:30am PDT. This information is for your personal, non-commercial use and may not be used for any purpose other than to identify prospective properties you may be interested in purchasing. Display of MLS data is usually deemed reliable but is NOT guaranteed accurate by the MLS. Buyers are responsible for verifying the accuracy of all information and should investigate the data themselves or retain appropriate professionals. Information from sources other than the Listing Agent may have been included in the MLS data. Unless otherwise specified in writing, Broker/Agent has not and will not verify any information obtained from other sources. The Broker/Agent providing the information contained herein may or may not have been the Listing and/or Selling Agent.