We posed a question earlier in the month and wanted to come back to it.
The question was whether the Manhattan Beach real estate market is currently "top heavy," possibly featuring more high-priced listings than demand can absorb. (See "Top Heavy? More Than 1/3rd of MB Listings Are $4M"," May 7.)
At the…
We posed a question earlier in the month and wanted to come back to it.
The question was whether the Manhattan Beach real estate market is currently "top heavy," possibly featuring more high-priced listings than demand can absorb. (See "Top Heavy? More Than 1/3rd of MB Listings Are $4M"," May 7.)
At the time, we cut the market into sub-$4M and over-$4M tiers, finding that 36% of active listings were priced in that upper tier.
Wasn't it curious, though, that in 2018, only 15% of sales had closed over $4M?
This was a hint that supply might be out of line with demand in 2019, but we were careful to say that we needed another look at the numbers.
With a new data run, we find something illuminating: Higher-end inventory seems to often swell quite a bit above the observed percentage of sales that eventually close at the higher end.
In other words, maybe it isn't so strange to find a disconnect, where a lot of the active market is higher-priced, even though a smaller percentage of sales by year end will actually fall in that higher-priced tier.
Consider some data. (These charts were produced for a forthcoming MBC report on the Manhattan Beach real estate market, which you'll hear more about soon.)
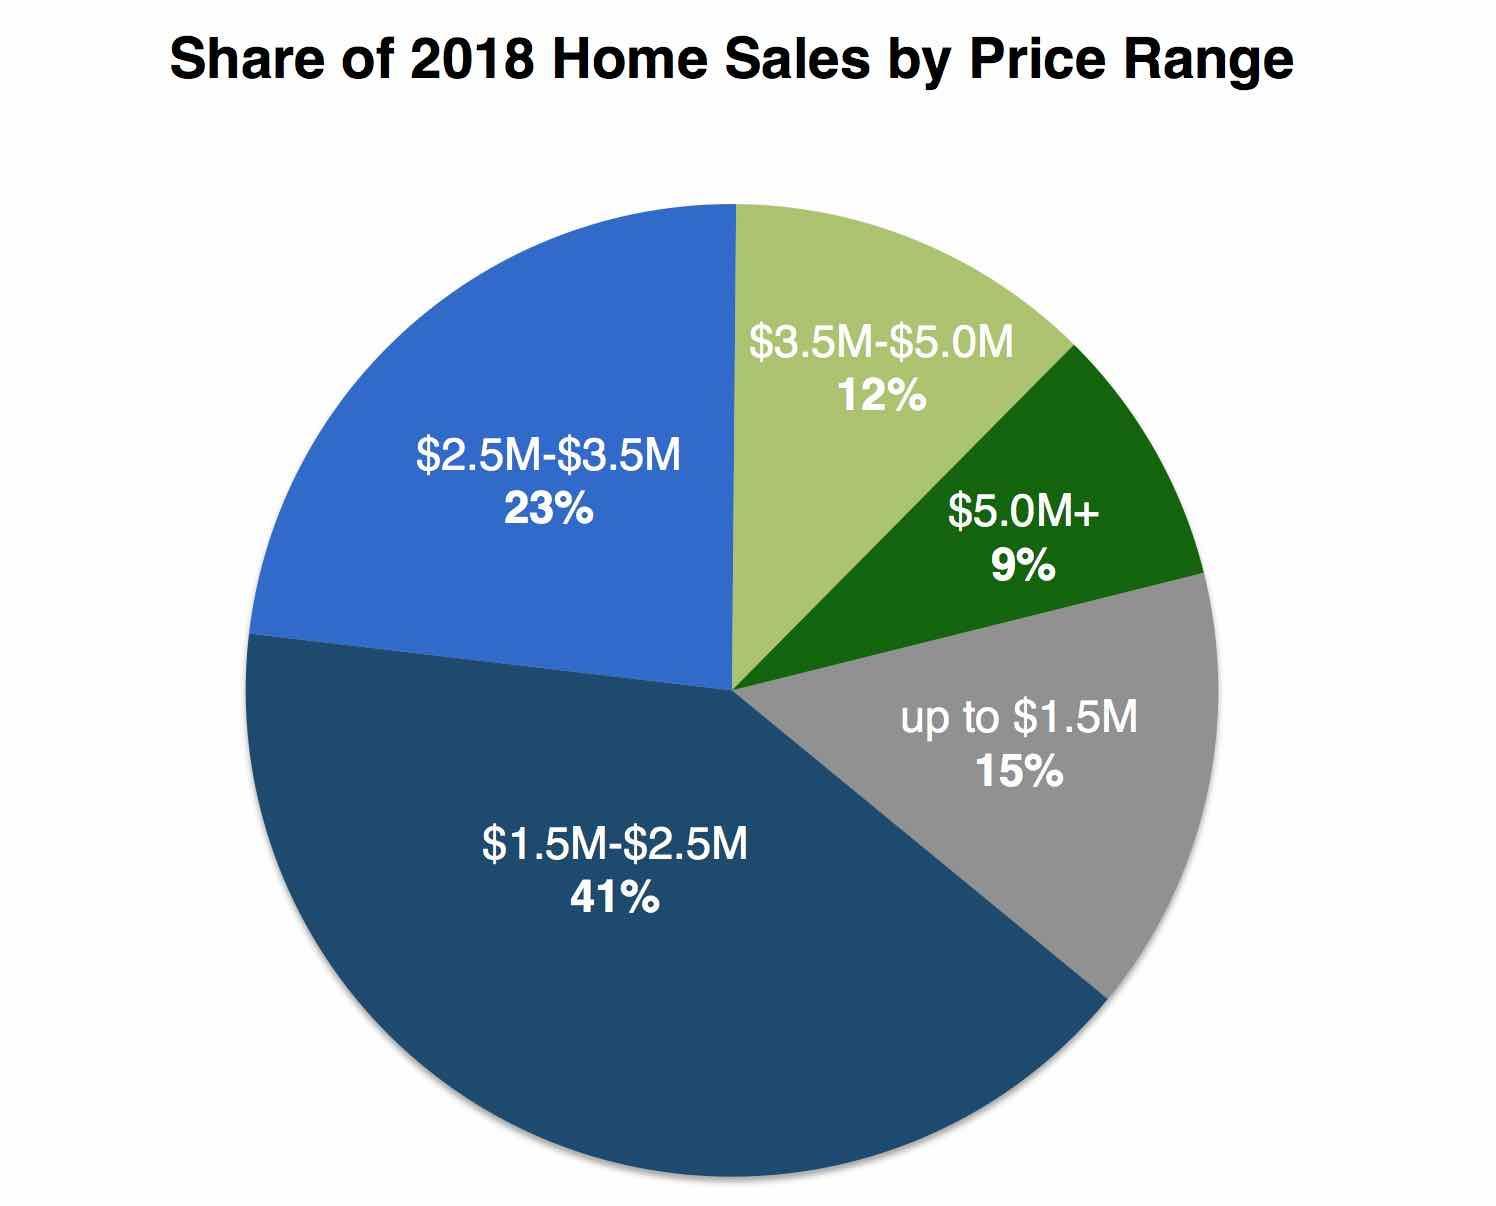 First, let's look at last year's sales totals for all of Manhattan Beach.
The two green areas show the percentage of 391 sales in Manhattan Beach last year that were priced at $3.5M and above.
It's a total of 21%, and it is the highest share ever recorded in Manhattan Beach.
You can see that the "entry level" of homes, priced up to $1.5M, made up just 15% of sales last year.
In 2012, that "low" price tier saw 55% of sales locally. Big change.
 Take a look at how the high end has grown as a share of the local housing market.
In just the past 5 years, sales over $3.5M have doubled to 20-21%.
This market segment has grown while the lower end has shrunk considerably.
We kept the left-edge scale for this chart at 60% for a reason.
That's because we'll now use the same scale to look at inventory.
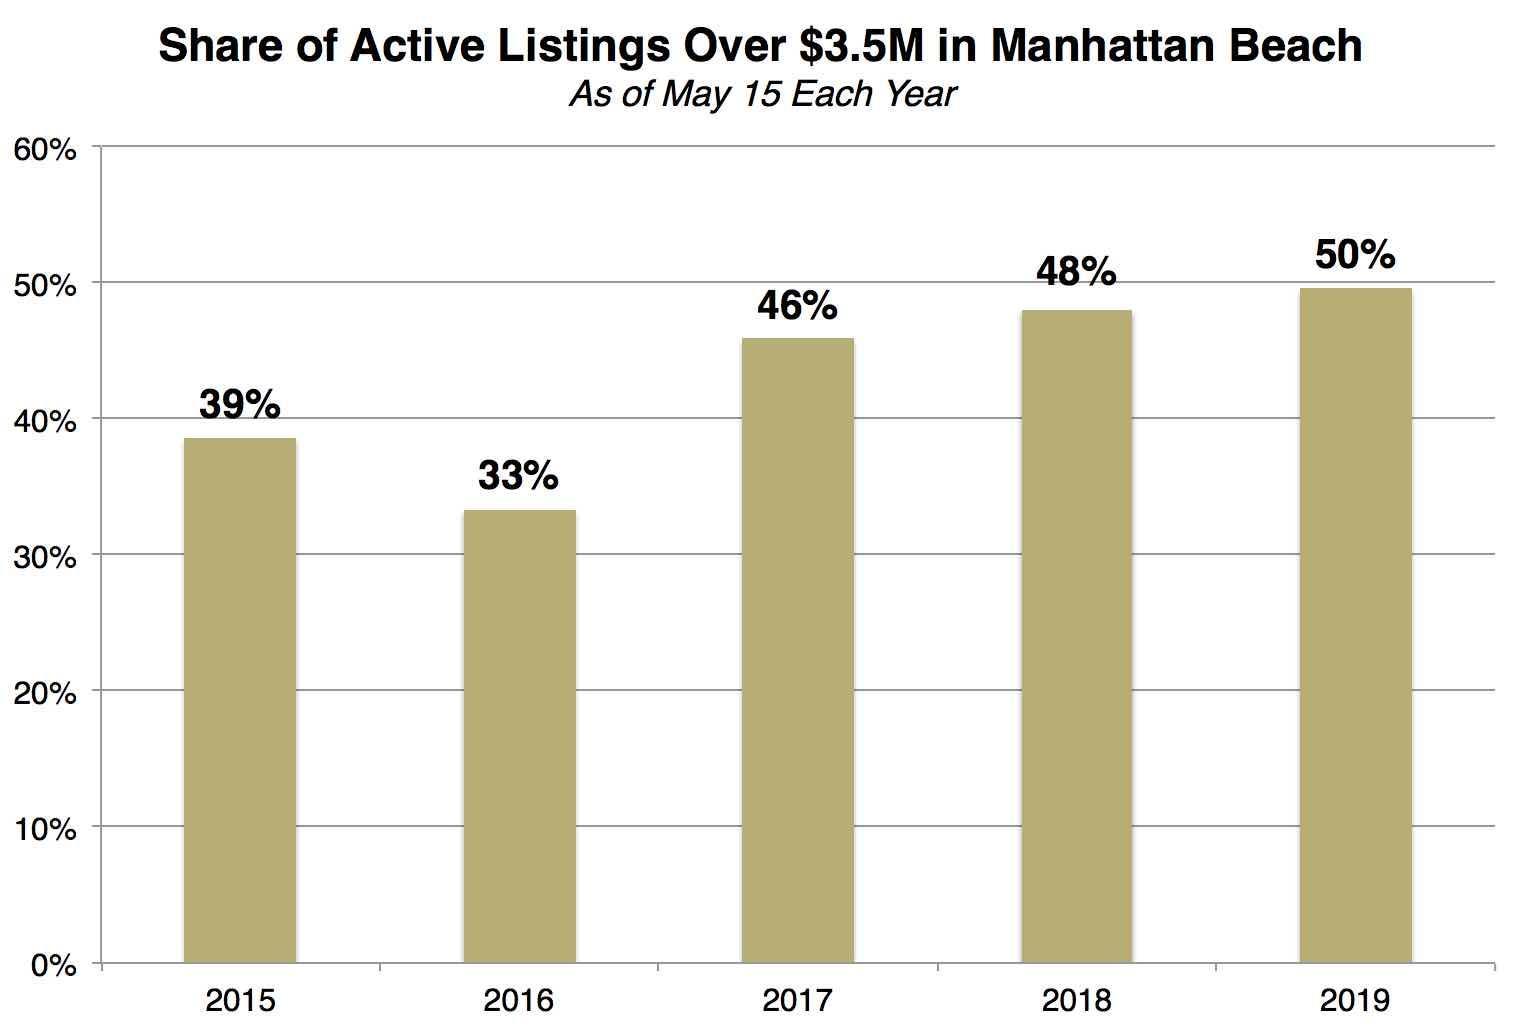 As of May 15 each year, the share of active inventory priced over $3.5M has always been considerably higher, in the 30s and 40s, and fully 50% as of May 15, 2019.
(These figures all come from our published MB Market Updates from each year.)
Some observations now.
First, it's still remarkable that half of the Manhattan Beach market is priced over $3.5M today. Standing on its own, that's an amazing stat.
Second, as we stated in the lead-up to these charts, it appears to not be very strange to have a disconnect between inventory levels by price tier and closed sales, at the end of the year, by price tier. Looking back, it seems that there's always a lot more for sale at the high end than one might expect.
Third, we'd like to know, as you might: Where the heck do all of these $3.5M+ listings go, if they're not sold?
It's possible this is a mid-Spring phenomenon. That is, sellers are all bringing out their higher-end offerings during prime time, hoping to sell quickly. But the reality is that pricier listings always take longer to sell. This may be an artificial "bump" in inventory at this time of year that works itself out by year-end.
Meantime, lots more homes priced under $3.5M are selling quickly, not sitting around on the market.
There's also a chance that higher-priced listings are disproportionately likely to cancel after failing to sell.
We'll take another look at these data and track some listings in a future report.
Meantime, enjoy a look at the latest $3.5M+ listings in Manhattan Beach. (At the time this post went live, there were 62 active; we can only display 48 within this blog post. Email subscribers will need to view this post online to see the listings.)
Newest Manhattan Beach Home Listings Priced $3.5M+
No matching listings right now.
Please see our blog disclaimer.
Listings presented above are supplied via the MLS and are brokered by a variety of agents and firms, not Dave Fratello or Edge Real Estate Agency, unless so stated with the listing. Images and links to properties above lead to a full MLS display of information, including home details, lot size, all photos, and listing broker and agent information and contact information.


