No doubt, a major explanation for the urgency in this year's real estate market in Manhattan Beach has been low inventory.
With our new chart, we can show you inventory at 2-week intervals for the whole year to date, up the the end of Q3 on Sept. 30.
 It has been quite a pinch all year.
We carried over 45…
No doubt, a major explanation for the urgency in this year's real estate market in Manhattan Beach has been low inventory.
With our new chart, we can show you inventory at 2-week intervals for the whole year to date, up the the end of Q3 on Sept. 30.
It has been quite a pinch all year.
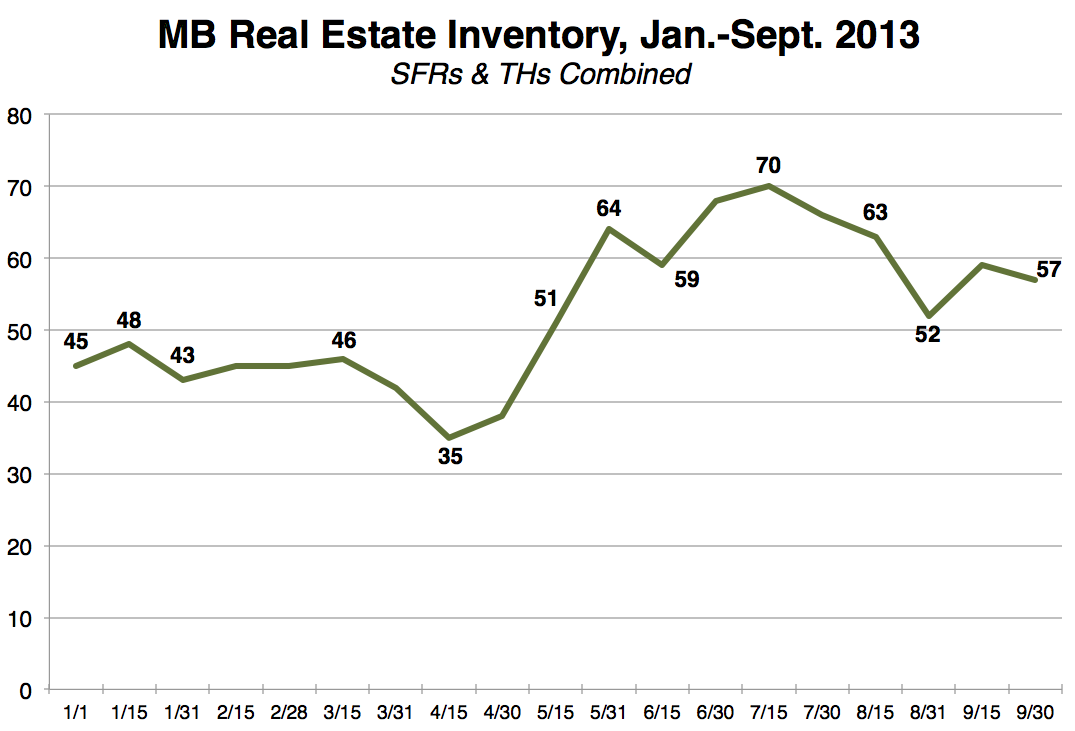
We carried over 45 listings – SFRs and TH's combined – from 2012 into the new year. Inventory was almost flat through mid-March, but dropped as April's rush and bidding wars took everything new off the market and more.
There was some accretion toward a peak – it's hard to call this a peak – of 64 at Memorial Day, and, after a pause, a yearlong "high" of 70 in mid-July, when everyone was on vacation.
Even the late-Summer options were absorbed and we came into September lower. There were 57 listings at month's end.
MBC did take note of a higher high of 73 just before that mid-July peak. It's not in the chart because we're basing this data on our twice-monthly MB Market Updates.
Now look back one year for something really amazing.
In 2012, we did not run systematic inventory check-ins or MB Market Updates. But we did have a few posts referencing inventory.
We went back to one post from September 2012 ("Inventory Dwindled") and found data checking in at a few points during the year.
 We've plotted those data points in red over the 2013 inventory numbers. As you see here, the 2012 inventory levels were literally "off the charts" compared to this year.
Look at mid-February. Last year: 93. This year: 45. Less than half!
First week of April. Last year: 80. This year: 42. Call it half again.
Only around Labor Day last year did inventory look a little bit like this year, with 67 on Sept. 6, 2012, and 59 on Sept. 15, 2013.
As you'll see in a forthcoming posts, sales totals are about the same this year. Inventory comes out and gets absorbed quickly. Buyers have had this feeling all year that if they don't act now, they lose it. Stuff doesn't linger. And if they're comparing to any of the past several years, they're right to feel that way.
Please see our blog disclaimer.
Listings presented above are supplied via the MLS and are brokered by a variety of agents and firms, not Dave Fratello or Edge Real Estate Agency, unless so stated with the listing. Images and links to properties above lead to a full MLS display of information, including home details, lot size, all photos, and listing broker and agent information and contact information.
Based on information from California Regional Multiple Listing Service, Inc. as of May 3rd, 2024 at 8:50am PDT. This information is for your personal, non-commercial use and may not be used for any purpose other than to identify prospective properties you may be interested in purchasing. Display of MLS data is usually deemed reliable but is NOT guaranteed accurate by the MLS. Buyers are responsible for verifying the accuracy of all information and should investigate the data themselves or retain appropriate professionals. Information from sources other than the Listing Agent may have been included in the MLS data. Unless otherwise specified in writing, Broker/Agent has not and will not verify any information obtained from other sources. The Broker/Agent providing the information contained herein may or may not have been the Listing and/or Selling Agent.


