If we're going to read the mood here, it seems like it's going to become a favorite sport of buyers and other local real estate analysts to spot the trend that shows the market is slowing under pressure from interest rates, and so on.
We've conceded, a market shift could happen. We do not think it will come fast, nor do we think it will hit here first. But we're of a mind to show you the data, and not opine too much.
As we said last week, it's hard to keep running uphill. You'll slow down. Depending on the hill, you might roll back down a ways.
But right now, the data aren't available to show that the market is slowing or that prices are coming down. You can predict, but you can't show it.
We'll look at recent stats on the pace of Manhattan Beach home sales and price outcomes.
First, we'll attempt to gauge demand based on the number of homes going into escrow.
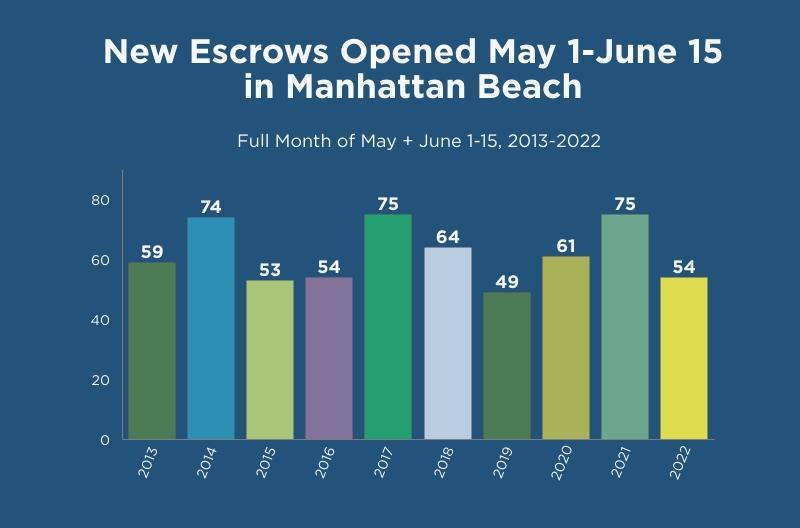 We've grabbed data for the past 6 weeks, spanning May 1-June 15, and compared to prior years.
The number of homes newly going into escrow here is drawn from our twice-monthly Manhattan Beach Market Update spreadsheets, published here continuously for years and years.
Here, we see the current period (yellow) being more or less on par with 3 prior years, 2015-16 and 2019. That's not great, as those were relatively slower years, but it's not like this year is a big outlier, either.
Naturally, we're way down in 2022 from ultra-hot 2021, and even from 2020, when the first half of May was still largely shut down. (The rebound by late May 2020 was fierce.)
For some comparison, earlier this year, we ran a similar analysis of the first 6 weeks of the "Spring market," March 1-April 15. In that case, 2022 more obviously lagged 7 of the prior 9 years. (See "Manhattan Beach Market Update for 4/15/22.") There were at least 4 ultra-hot starts to the Spring season that dwarfed 2022's start.
With this latest 6-week data snapshot, though, we see 3 hot years besting our May 1-June 15 stretch, not 4 years, while this year otherwise looks normal-if-slower alongside the others.
And if you want to look at only the very most recent period, June 1-15, 2022, had more new escrows (19) than 4 of the past 9 years, and this period was within 3 new deals of every year except 2020 and 2021.
 To look at a different measure, are buyers getting markdowns recently?
How big do you want your data set?
Anecdotal: Within a one-week period, one set of Dave's clients sold a home (1901 Lynngrove) for $126K over asking, while another set of clients purchased a home (763 29th) for $150K under asking.
So, no & yes.
Don't base your analysis on two sales, of course.
Out of the last 10 sales to close in MB, 6 were over asking, and 4 were under.
Let's go bigger.
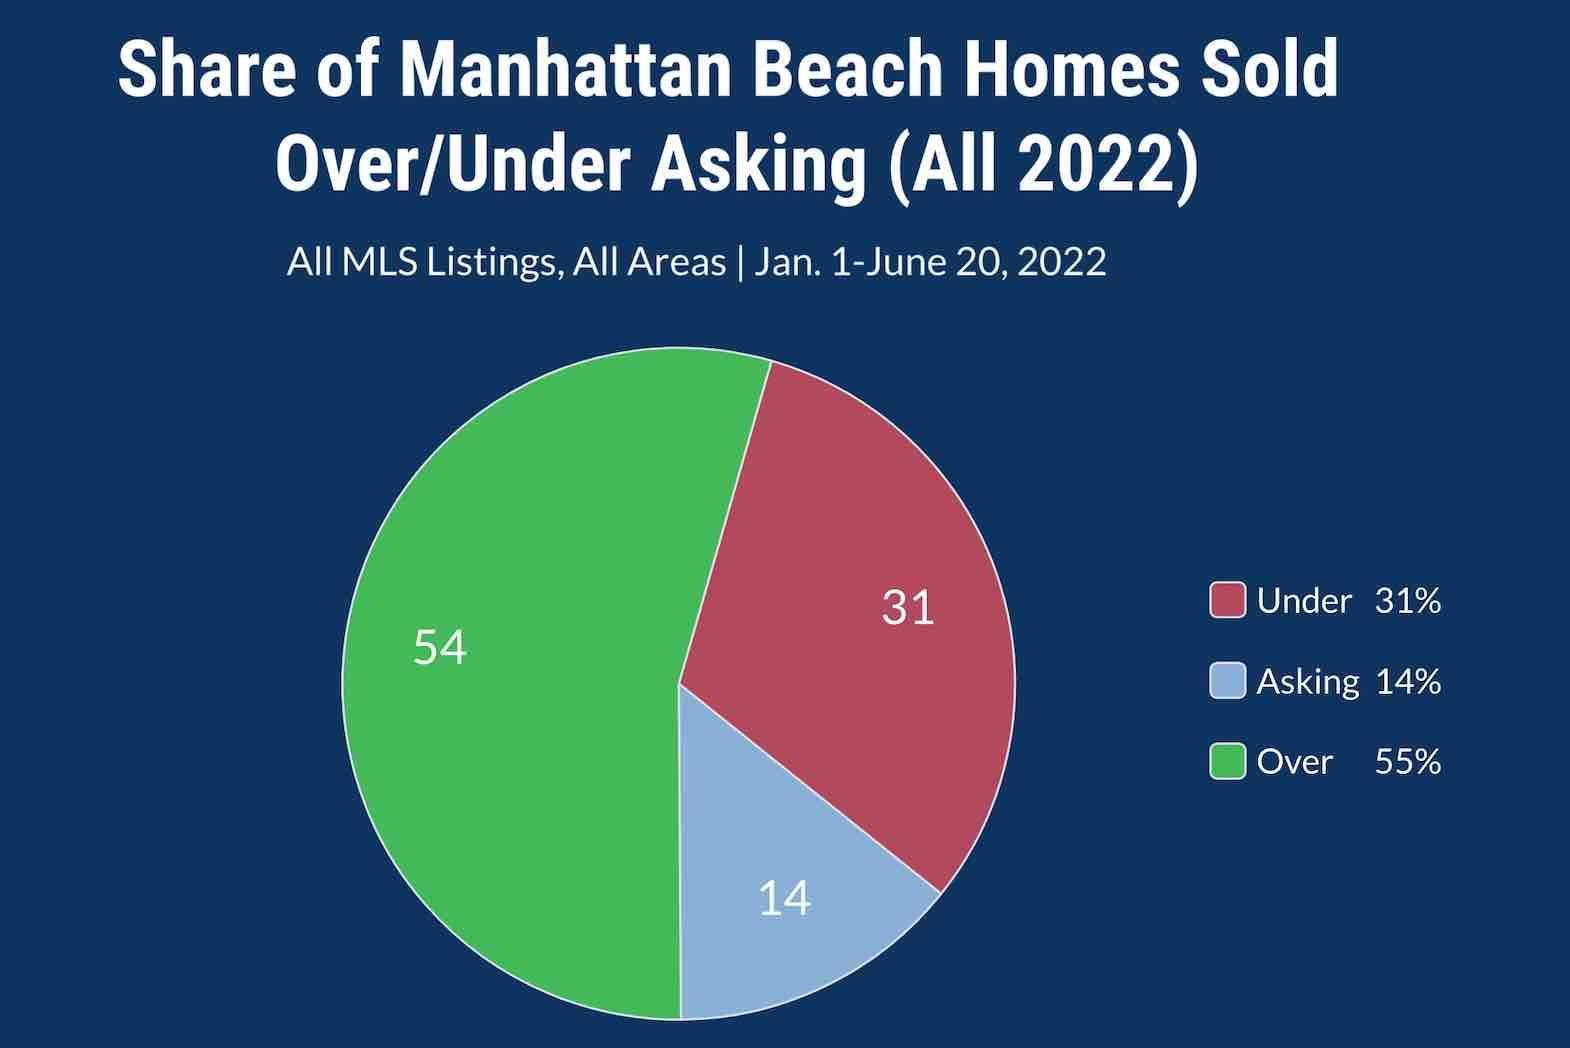 Annual: Year-to-date, there have been 160 closed sales in Manhattan Beach. (Through June 20.)
Of all sales closing in 2022, most (54%) have sold over the asking price.
Fewer than one-third (31%) have sold under asking.
The balance, 14%, sold right at the asking price.
Now let's narrow the focus.
Spring months: We separated some of the Spring market away from the first 3 months of the year.
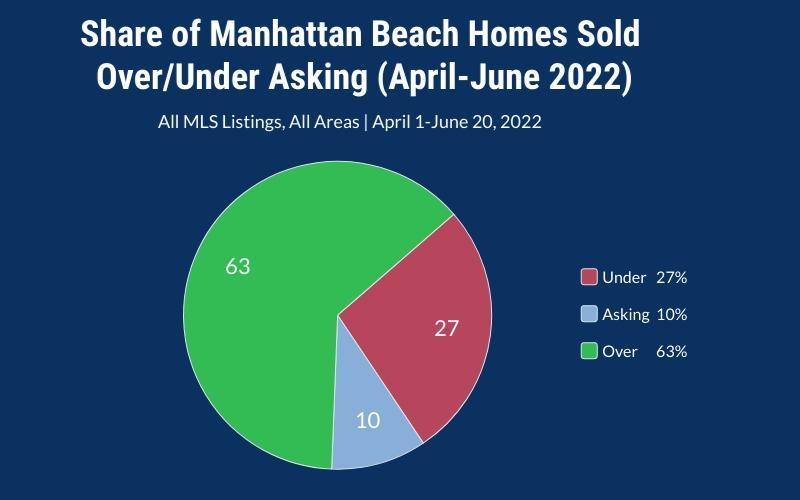 From April 1-June 20, a larger portion of homes sold over asking, while lesser portions sold for asking price or less.
In this case, the tilt in favor of sellers is pretty sharp, with 63% of MLS-listed homes selling over asking price, and closer to one-quarter (27%) sold under asking.
To be fair, if you cleaved off the busier Spring months from the first part of the year in any given year, this is the kind of comparison that you might expect to see.
Early in the year, closings come from deals made in November through January, a time when listings that are still around more often have taken public price cuts, or have to take less to make a deal.
Meanwhile, in the thick of Spring, there tend to be more buyers out and more competition. Thus there ought to be more over-asking sales than in the early part of the year.
If you want to say something like, "a profound market shift is under way now, but it's too soon for it to show up in data like this," then, heck, we can agree with at least half of that statement.
We promise to come back and look at the same numbers - and more - throughout the year.
Here's the rest of our local real estate market update report for the period ending 6/15/22:
> 58 active listings as of 6/15/22 (+4 from 5/31/22)
> 45 SFRs (+4)
> 13 THs (flat)
See the Inventory list as of 6/15/22 here, or see the MB Dashboard for up-to-the-minute data.
Active listings by region of Manhattan Beach in this report:
> Tree Section: 6 actives (-1)
> Sand Section: 28 actives (-2)
> Hill Section: 8 actives (+2)
> East MB: 16 (+5)
We're also providing a report on closed sales by region of MB
Sales data, including PPSF for all properties, are organized by sub-region of Manhattan Beach.
Here's a link to the spreadsheet: "MB Pending/Sold as of 6/15/22".


