Median prices can be an awful way to measure property values, except for all the other ways.
In a city with housing stock as diverse as MB’s, medians can mean little to any individual property. Depending on where you look, you’ll find parts of MB’s housing heritage on almost every block. So what’s a “median house”…
Median prices can be an awful way to measure property values, except for all the other ways.
In a city with housing stock as diverse as MB’s, medians can mean little to any individual property. Depending on where you look, you’ll find parts of MB’s housing heritage on almost every block. So what’s a “median house” in MB? What does “median price” mean, then?
Looking at median values over time can, at least, tell us something useful about
trends.

Two-and-a-half years ago,
when MBC launched, a premise was that “home prices” were “dropping.” A trend appeared to be forming at the time. Much information published here over time has been focused on pricing trends, hints of pricing trends and portents for the future. (A classic is "
Getcher Predictions Here" from Sept. 2007, worth revisiting.)
On a house-to-house basis, the notion that prices were "dropping" has certainly proved true – purchases made two and a half years ago in 2007 cannot be resold now for the same money. (More on same-house sales in another post soon.)
Dropping prices are also a clear trend we see in median prices over the past 3 years. In fact, the current year-to-date median for MB is basically flat against the year-end median for 2004.
But is the downtrend over?
A look at the data quarter-by-quarter has some people wondering if MB has bottomed and is headed back up.
What to believe?First, some quick background. The data featured in this story come from an MLS data run, covering SFRs in all of Manhattan Beach, not just west of Sepulveda, MBC’s usual coverage area. This is different than some past MBC stories using DataQuick data, which are more inclusive of all transactions.
These data come courtesy of a
frequent commenter – no, something more than that… Dare we say, an
informal “partner” in the daily discussion of MB real estate that occurs here at MBC. (No, that won't sit well at all.) OK... the data come from an
anonymous local realtor who fancies himself the yang to this blog’s yin, not exactly a fan, who nonetheless seems to share our goal of offering information free of charge to help MB residents and would-be residents to know more about what's going on in the local housing market. We offer our sincerest thanks.
So what do the numbers say?
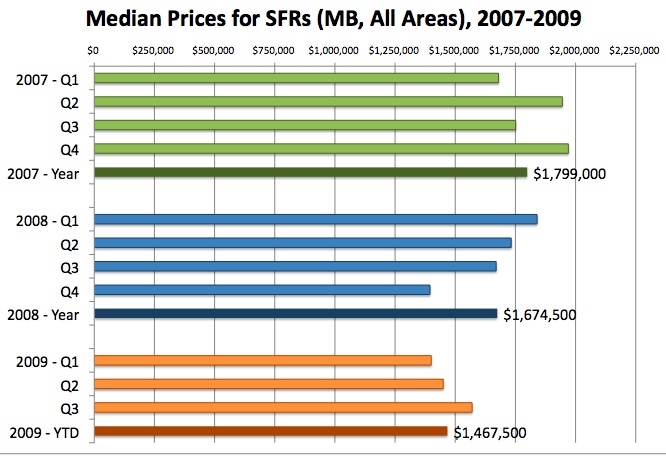
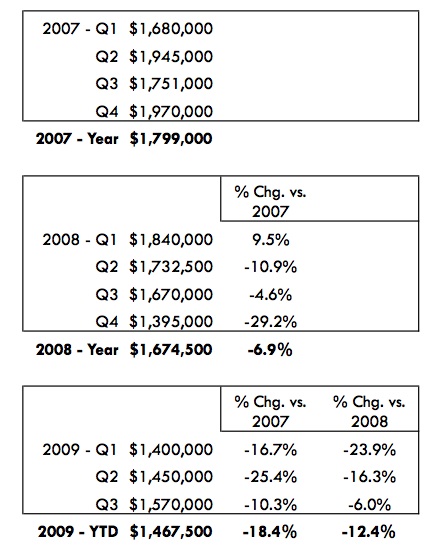
Our first chart
(click to enlarge) shows that quarterly data in graphic form. We see the median price in 2007 flitting between $1.6m and $2.0m, settling on a
$1.799m for the year. Impressive, especially that fourth quarter in light of the onset of real financial troubles in Summer that year.
Clear downward motion (leftward, in this graph) began in earnest in 2008, shrinking toward a fairly low fourth-quarter median of
$1.395m. The final figure for the whole year was a somewhat healthier
$1.674m,
down 6.9% from 2007. (Interestingly, the Goldman Sachs prediction for the national housing market was -7% in 2007, as seen in "
Getcher Predictions Here.")
This year, after a first quarter at $1.4m even, the quarterly trend is up. (The first quarter was pretty bleak, as we noted in "
Pace Slower, Prices Lower" in July.) The third quarter came in at
$1.570m, healthier, but still down 6% from the same quarter last year.
The year-to-date median price for 2009 as of Sept. 30 was
$1.467m,
down 18% from 2007's year-end figure, and
down 12% from 2008.
(Click chart to enlarge these comparative data.)Today's median is not much different than the year-end median price for MB in 2004:
$1.450m in nominal (unadjusted) dollars.
In short: 2009 is still way down from last year, pushing MB all the way to 2004 values, but there's some basis for the statements you hear all over town about prices "firming" or trending up.
Indeed, if that first graph were vertical instead of horizontal, you might see a "V" shape not unlike a graph of equities markets over the past year or so.
As with equities, there's some debate about whether this apparent "recovery" is real, whether the "bottom" was too deep, or what exactly is behind any upward trend we can see. (And this concludes our ham-handed analogy of the local real estate market to the economy at large.)
Sales mix is an issue worth some attention. In July, right after noting a
slow sales pace and dropping median prices this year, MBC took note of the
sales mix, which had skewed very significantly toward the lower end earlier this year. Clearly more homes have been selling above $1.4m or so in recent weeks and months. Is that a firming of home values, or something else? We'll examine the data in a separate post soon.
For now, the question is, are we really living in 2004 prices, and if so, for how much longer?
Please see our blog disclaimer.
Listings presented above are supplied via the MLS and are brokered by a variety of agents and firms, not Dave Fratello or Edge Real Estate Agency, unless so stated with the listing. Images and links to properties above lead to a full MLS display of information, including home details, lot size, all photos, and listing broker and agent information and contact information.