Over the past 5 years, Manhattan Beach median home prices have hit ever-newer heights.
At $2.600M at year-end 2020, the median had jumped $250K from only a year earlier. And that was $500K above the median price from 5 years prior.
Yet Manhattan Beach prices have not risen as much, percentage-wise, as most…
Over the past 5 years, Manhattan Beach median home prices have hit ever-newer heights.
At $2.600M at year-end 2020, the median had jumped $250K from only a year earlier. And that was $500K above the median price from 5 years prior.
Yet Manhattan Beach prices have not risen as much, percentage-wise, as most other cities and areas of the South Bay, and the city has lagged the South Bay as a whole.
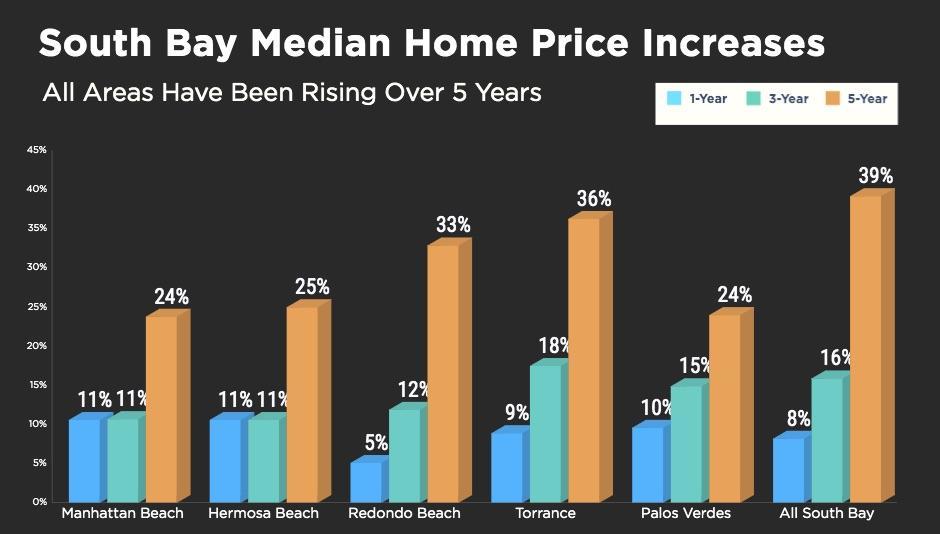
Since early 2016, the median price for the overall South Bay market has risen 39%, while Manhattan Beach rose 24%.
(We have defined the South Bay for these purposes as the three beach cities, Torrance and the vast Palos Verdes region. Some other cities sometimes roped in with the South Bay are not included in this data.)
The variation in 5-year data trends is fairly clear. The somewhat lower-priced cities, Torrance and Redondo Beach, showed the greatest growth. Higher-priced markets, including Manhattan and Hermosa Beach and Palos Verdes, rose at virtually the same rate over this time, 24-25%.
A snapshot of just year-over-year data, comparing year-end 2020 to year-end 2019, shows somewhat greater price increases in the higher-priced markets. While the other markets saw price increases, also, luxury markets were the bigger winners in the COVID-19-influenced real estate market last year.
All three beach cities are fairly steady at the 3-year mark, with 11-12% increases, while PV was up 15% and Torrance 18%.
Now, we mentioned that the beach cities have the highest prices overall, which is not likely to be a big surprise to you.
The interactive chart we're posting below allows you to "roll over" and spot the median prices at each point on the 5-year chart, for any of the cities or regions of the South Bay. (This feature only works on the website directly, not in email. See the post online here.)
Something we found quite notable: See how Redondo Beach's prices and trends so closely match the South Bay as a whole. The large city has both pricey coastal real estate and inland areas, not to mention lower-priced condos. Somehow the mix almost perfectly mirrors the region.
Enjoy the chart:
#sbmedians#
Please see our blog disclaimer.
Listings presented above are supplied via the MLS and are brokered by a variety of agents and firms, not Dave Fratello or Edge Real Estate Agency, unless so stated with the listing. Images and links to properties above lead to a full MLS display of information, including home details, lot size, all photos, and listing broker and agent information and contact information.
Based on information from California Regional Multiple Listing Service, Inc. as of July 27th, 2024 at 3:55am PDT. This information is for your personal, non-commercial use and may not be used for any purpose other than to identify prospective properties you may be interested in purchasing. Display of MLS data is usually deemed reliable but is NOT guaranteed accurate by the MLS. Buyers are responsible for verifying the accuracy of all information and should investigate the data themselves or retain appropriate professionals. Information from sources other than the Listing Agent may have been included in the MLS data. Unless otherwise specified in writing, Broker/Agent has not and will not verify any information obtained from other sources. The Broker/Agent providing the information contained herein may or may not have been the Listing and/or Selling Agent.


