For all of 2016, housing inventory in Manhattan Beach has been higher than in any of the prior three years.
Truly, these kinds of inventory numbers haven't been hit since at least 2008 or so, but we're focusing here on the change in the market now compared to very recent times.
A chronic "shortage" of homes for sale clearly contributed to the rapid rise in prices from 2012-15. (The median price for MB is still up this year. See "Would You Believe Prices Are Up?" from October 2016.)
Now that the "shortage" is over, the question might be: What other factors will sustain prices?
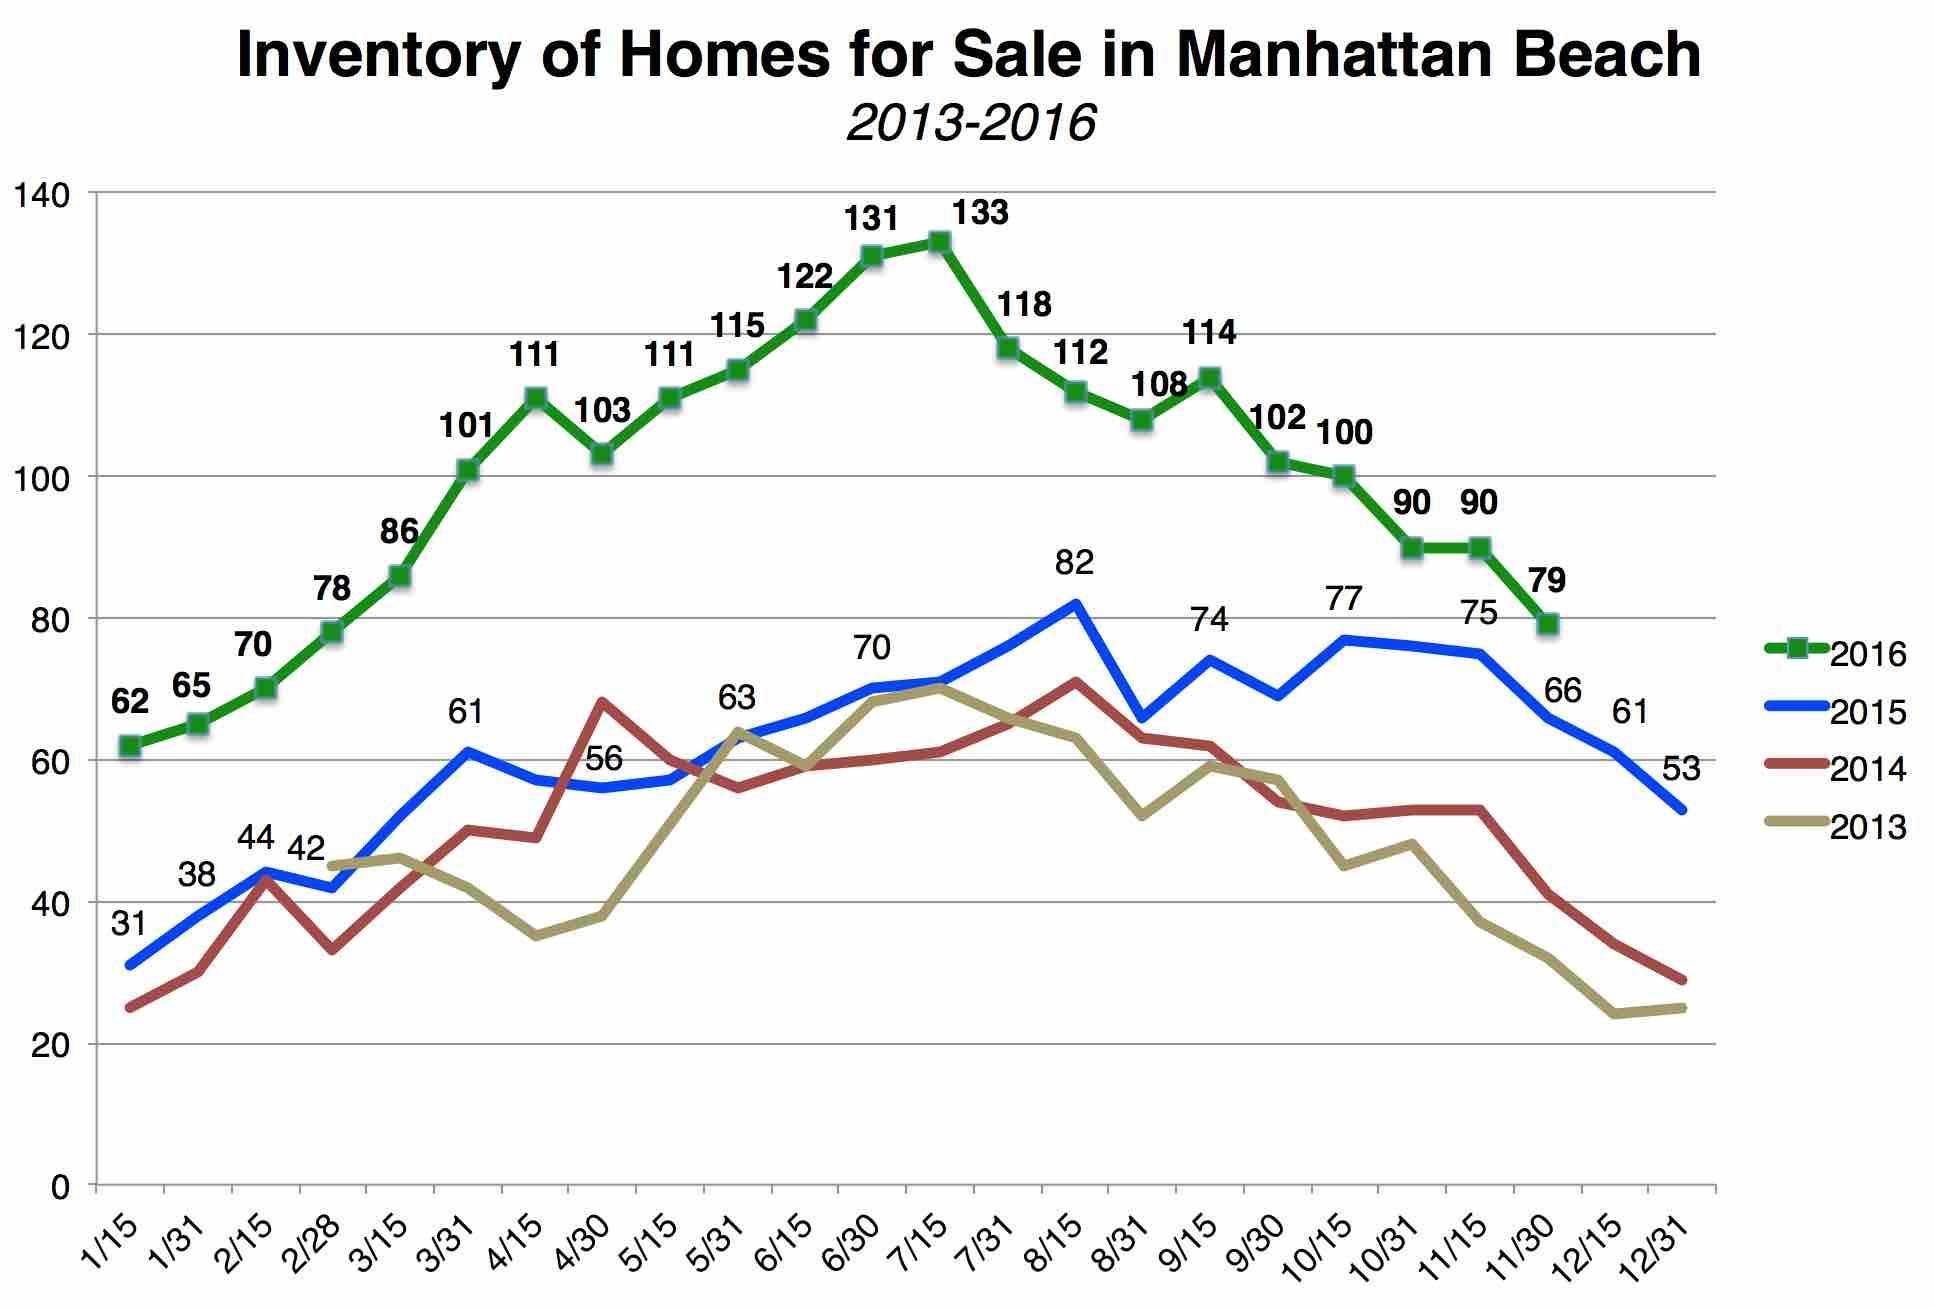
Our chart above sets each year against the others, looking at data citywide. A few things are readily apparent:
1) Growth in inventory began around Summer 2015,
2) Inventory has persisted far above 2013-14 levels for nearly 15 months,
3) With as many as 25-60 extra listings for most of 2016 over 2015, the gap is narrowing now, and
4) The current dropoff in homes for sale as the holiday season dawns is totally normal, part of expected seasonality.
We saw inventory peak at 133 this July, about 60 higher than July 2015 (+80%).
Now, let's take a deeper dive, of the kind we've never done here at MBC. This is a special indepth analysis for MBC "Insider" members, the first or our new series. We'll reserve premium content like this for readers like you.
Here now, we will look at inventory trend data broken down by area of Manhattan Beach.
Here are 4 consecutive charts covering the different areas of MB.

What did you notice in there?
First, let's just kind of look past the Hill Section data. It's a noisy chart due to very low inventory, regardless of year.
We see that every other area had some kind of peak in the Summer of 2016, which is exactly why, citywide, we hit an inventory high then.
But these charts do tell us something else that we were hoping to find by building them: Where inventory growth has been the greatest, and most sustained.
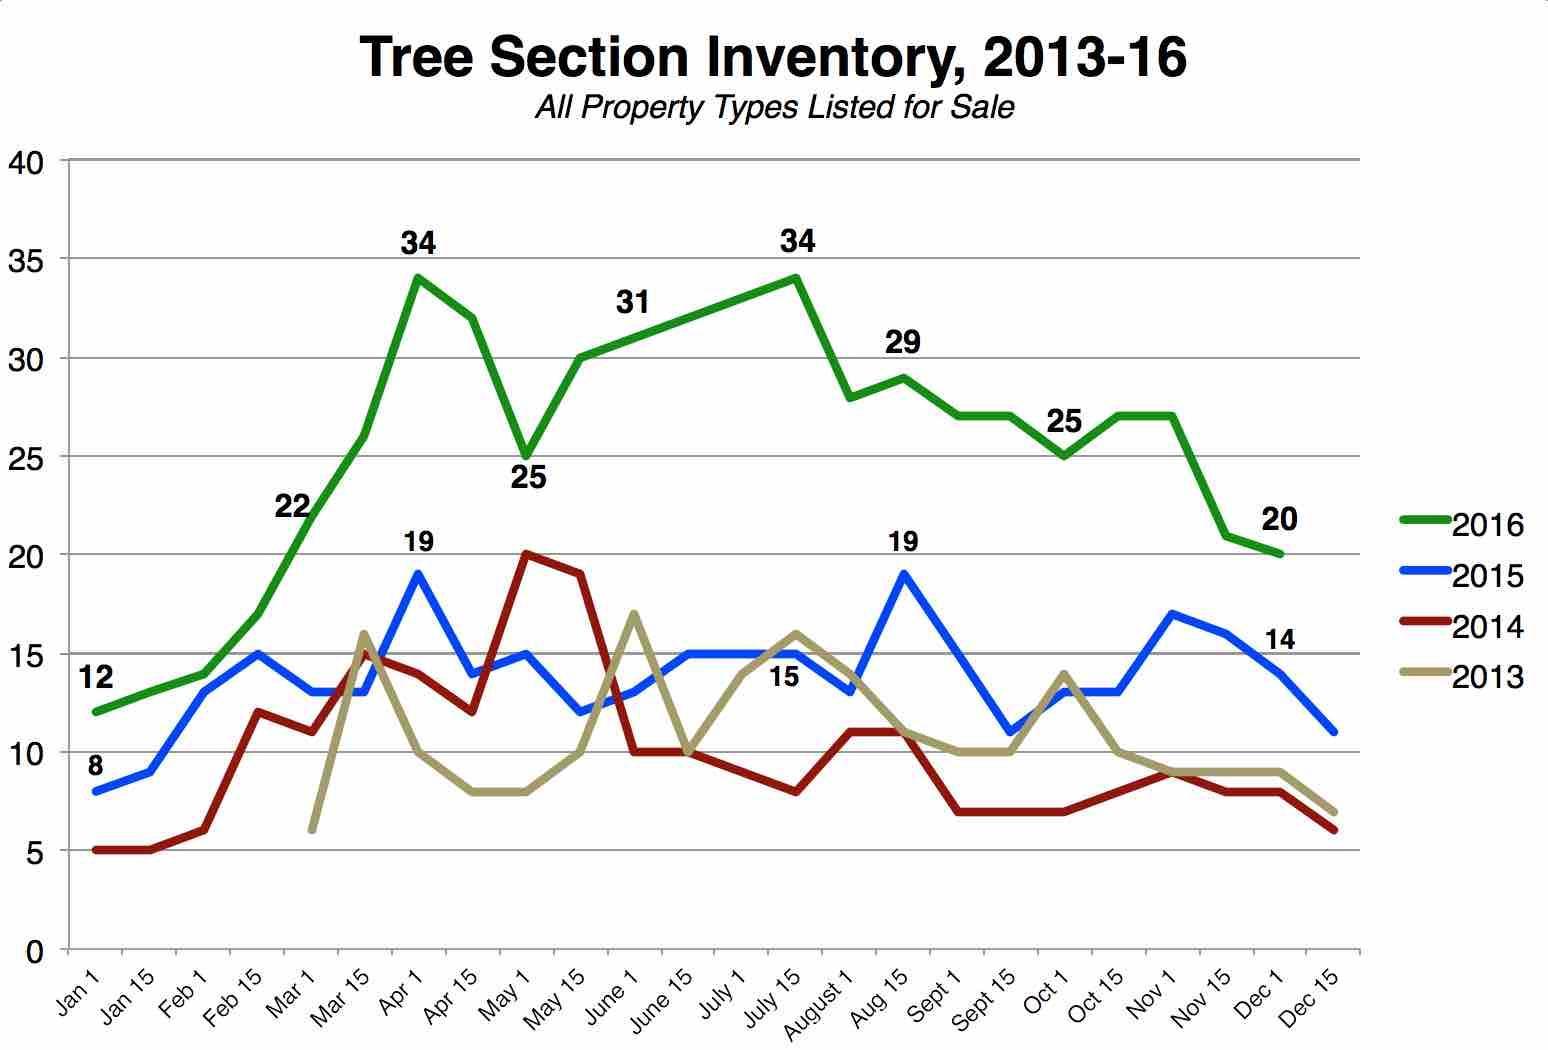
 Tree Section, we're lookin' at you.
It's in the Tree Section that 2016 has seen the greatest inventory difference from prior years, running at any given moment from 10 to 15 to 20 or more listings above the same time in 2015, with even greater gaps over 2013-14. The way that green line for 2016 hangs above all the rest is the tell.
So, are people just tired of the Tree Section? No buyers?
Wrong guess. It's not flagging demand in the Tree Section that's to blame.
Year to date, we've seen 109 sales closed in the Tree Section. That's more than in 2014 and fully 15 more sales than in 2015. Only go-go 2013 had more sales in the first 11 months of the year, at 116.
So if buyers have been just as active – even more active – this year, then why is Tree Section inventory hanging around so high, persistently?
There are just more sellers in the Trees. We suspect that new construction is part of the answer, but not the whole story, either. We'll try to look at Tree trends separately here at MBC soon.
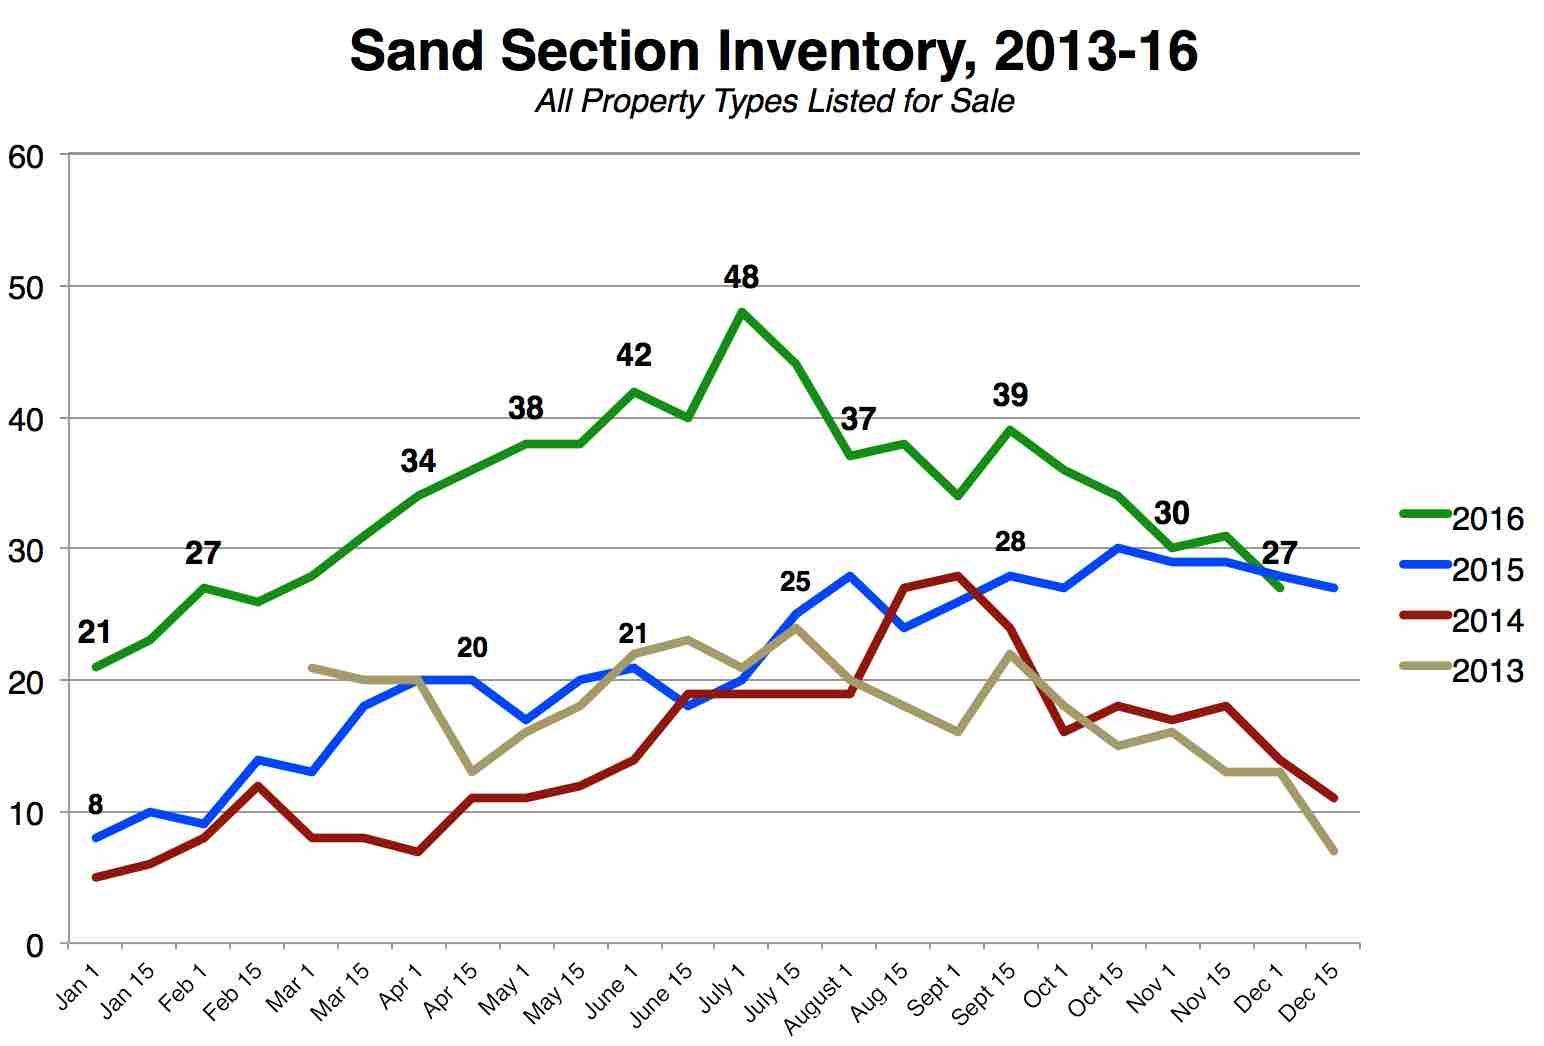
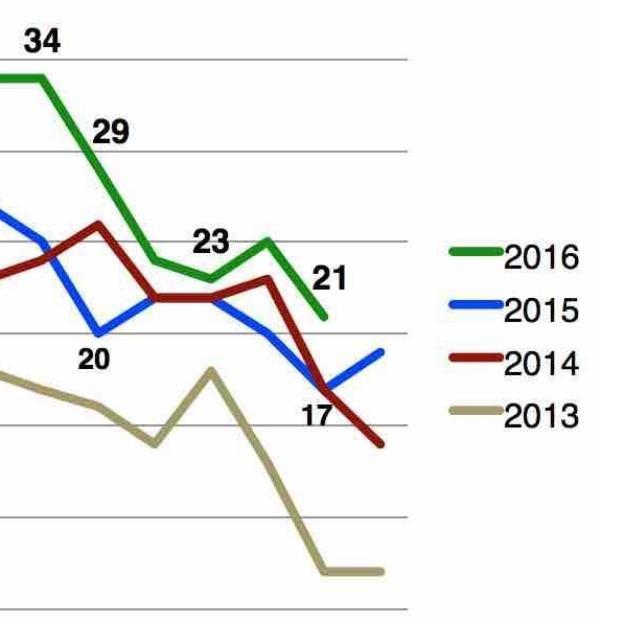
Now looking again at the inventory charts, there's a comparable nearly-year-long trend in the Sand Section, with inventory almost always notably higher than past years. And it's interesting to see the Sand Section having hit the absolute peak for all areas of MB in Summer at 48 listings. That's a bit out of character.
Often, East Manhattan will have more listings just due to the sheer size. (Here on MBC we combine 3 MLS areas, representing about half the city, into one category called "East MB," so it should have more listings, right?)
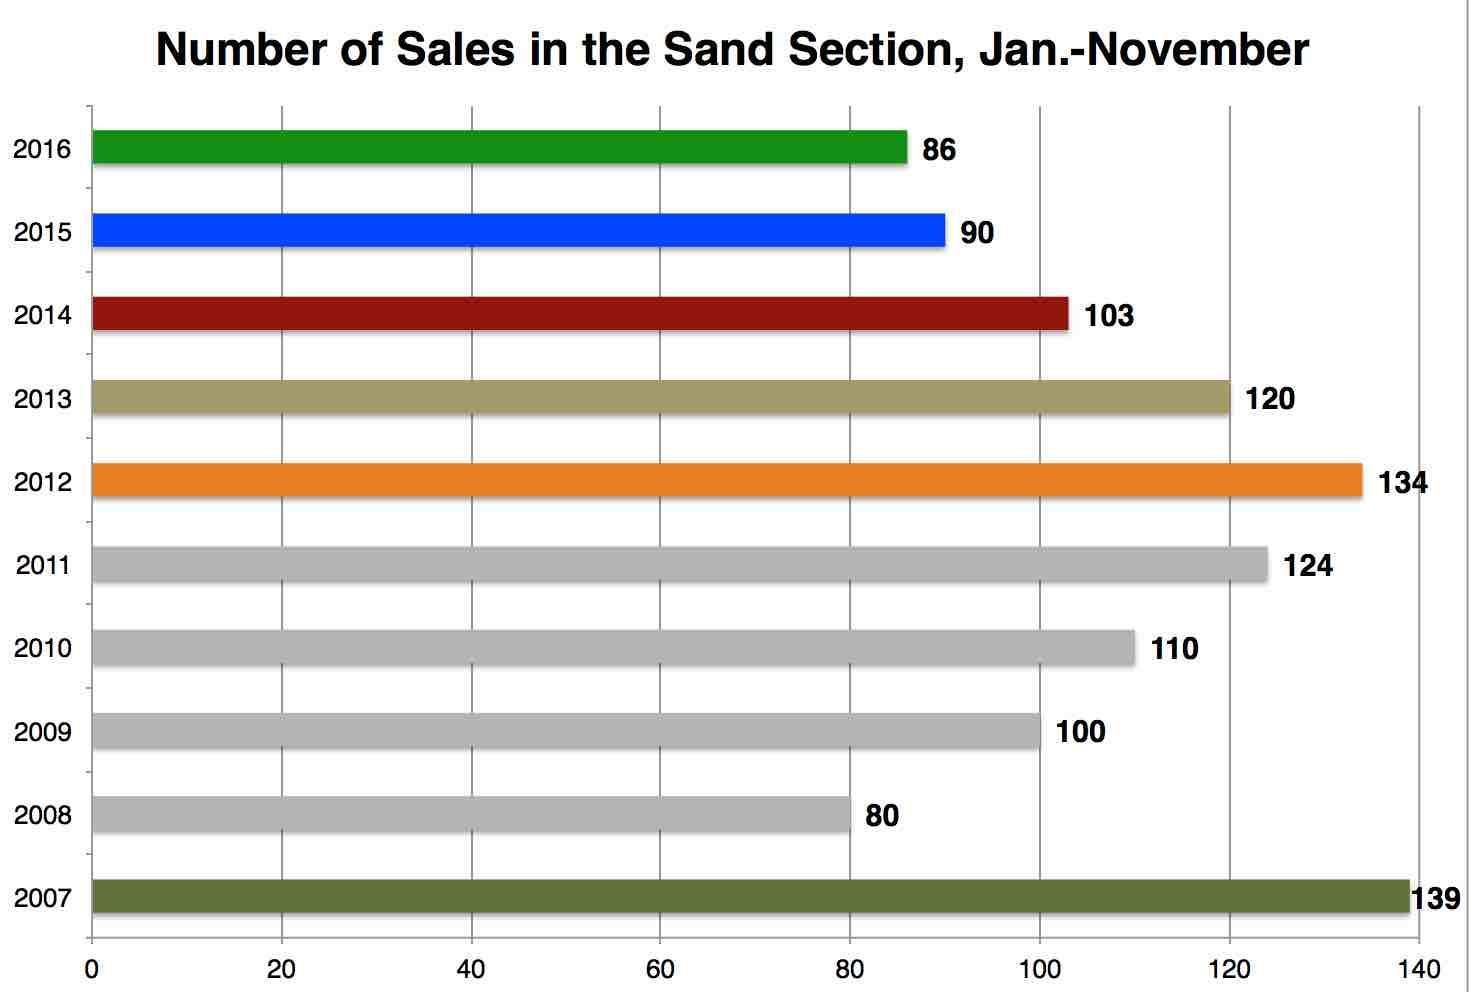 The burst of inventory around Summer has a more interesting tie to sales stats in the Sand Section. And it's a more concerning note. The number of Sand Section sales year-to-date is only 86, down from 90 last year and from 120 in 2013.
We dug even deeper to see what's up at the beach. Turns out, the YTD sales figure for the Sand this year is the lowest out of the past 10 years other than 2008, when, you may recall, the world collapsed. This year was the 4th consecutive year of declining sales after a recent peak in 2012.
Even super-depressing 2009 had 100 sales in the Sand Section by this time of year.
So while demand in the Trees is steady or even up in 2016, it's down in the Sand. Why? if you want one hypothesis: It's got to be prices. The slowest category of sales this year has been the higher end, and the Sand Section has a lot of those listings. Fewer buyers can hit those numbers, it would seem. Perhaps buyers still want the beach, but for less?
Take a look at the last part of the Sand Section inventory chart above: Inventory for 2015 and 2016 looks about the same for the last part of the year. Lines cross. But there's a lot of white space as you look to the 2013-14 figures. So these last 2 years are similar, but still higher. Watch the beach.
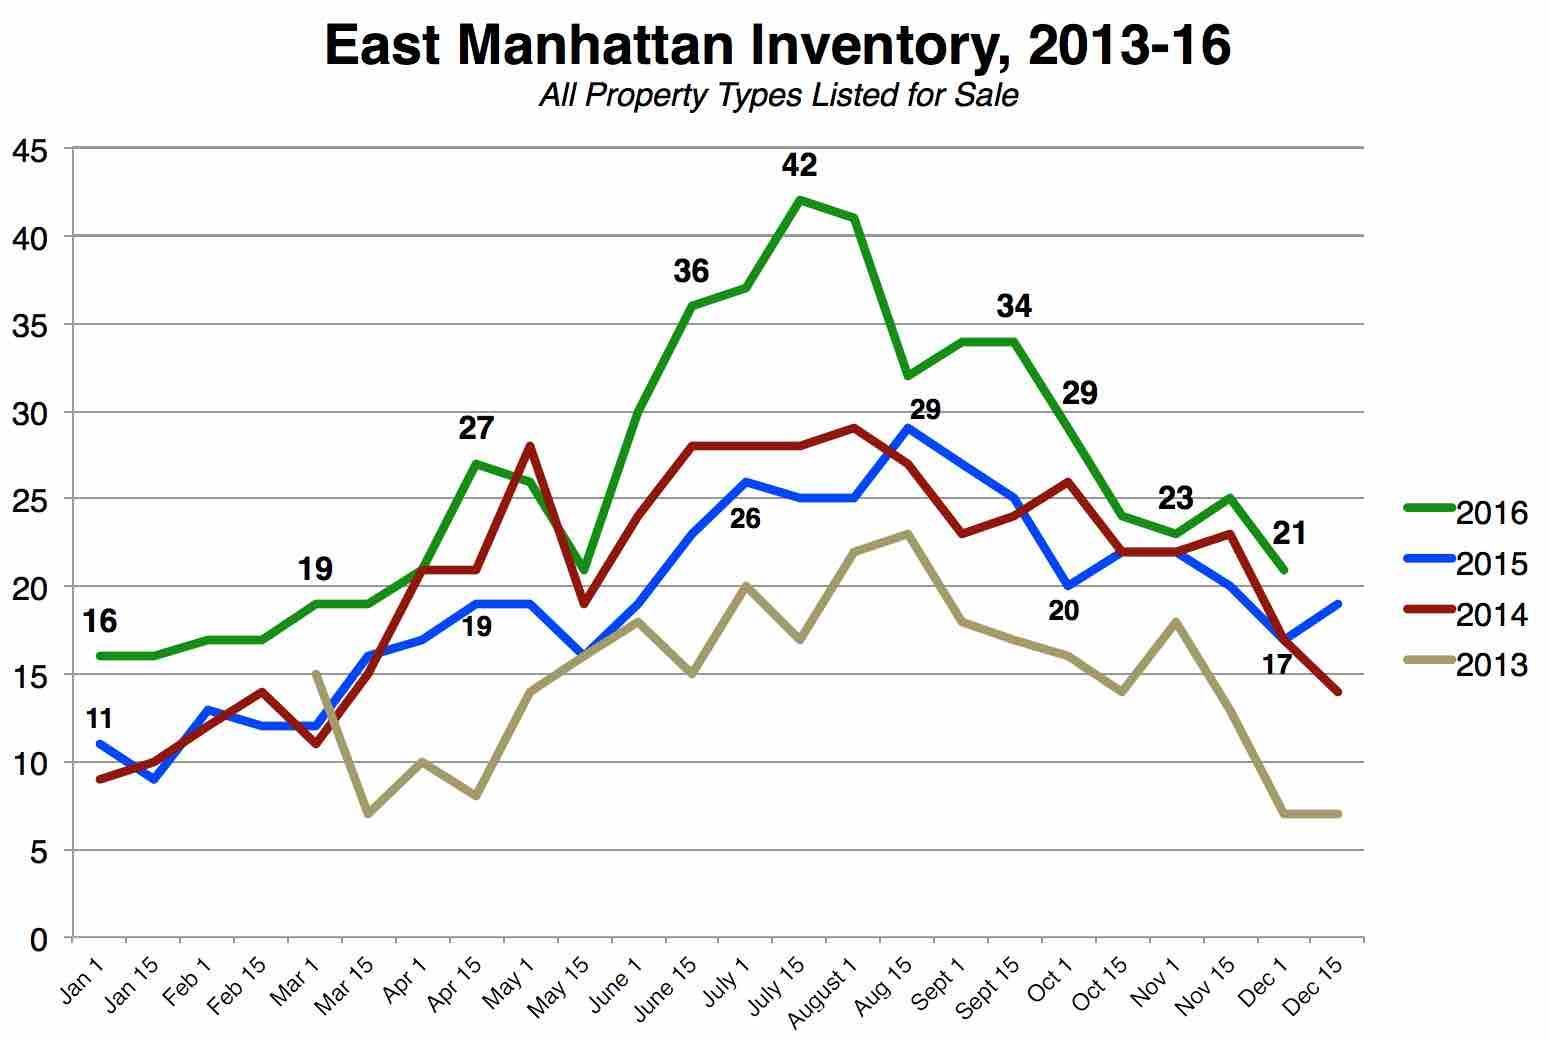
Now take a look at East MB. The red and blue lines for 2014 and 2015 tell you something interesting that's not true of the Sand or Trees. Last year, there wasn't really a notable growth of inventory. Sometimes, 2015 levels were lower than 2014. So while it's still true that East MB inventory in 2016 has always been higher than the prior 3 years (save for one moment in May 2016), it's a one-year trend, not a 2-year trend. And now the major excess from mid-Summer has been worked off.
 Each year's late-season trends for East Manhattan look similar, and the total inventory figures aren't that greatly different. It's as if East Manhattan is ending the year on a don't-panic type of note.
And would you be surprised by this?
Sales are up in 2016, and very consistent for all of East MB over all 4 years in our data here.
As with the Tree Section, this year's a bit better on the east side. There are 141 closed sales year-to-date in East MB, up from 131 last year. The high was 142 in 2014, and the low was actually in 2013 at 126.
So, yes, East Manhattan had its big anomalous inventory bulge from June-September. But the situation has mellowed, and sales are steady.
Thanks for joining us on this deep dive.
We could keep swimming in these data, but don't want to lose you, or make too many unsupported observations.
We haven't even mentioned a pet topic we hear discussed: MB inventory seems very low compared with the size of the market and even history. What's the percentage of homes built in Manhattan Beach that are for sale now, compared with any similar market? Maybe we're at 1% of all housing stock for sale now. What you'd want to know is how many are typically for sale in a given area. Hmmm, Dave.... Worth another data dive?
Our Manhattan Beach inventory data here may portray a market poised to soften, but be careful before you say you're sure. What if there are still more buyers ready to go, who just aren't finding their matches in the relatively limited choices available now? In other words, what if "higher" inventory isn't high enough to meet buyers' expectations? In other words, what if more inventory simply meant more sales, not a glutted market?
We'll keep looking for data, and appreciate your input as well.


