The second part of October was definitely busy in Manhattan Beach, with 20 new escrows opened in that brief period.
Of those, almost half of the new deals were made in the Sand Section, which has had its challenges this year.
Maybe we'll end this year with a push of momentum in the market?
 Of the sales…
The second part of October was definitely busy in Manhattan Beach, with 20 new escrows opened in that brief period.
Of those, almost half of the new deals were made in the Sand Section, which has had its challenges this year.
Maybe we'll end this year with a push of momentum in the market?
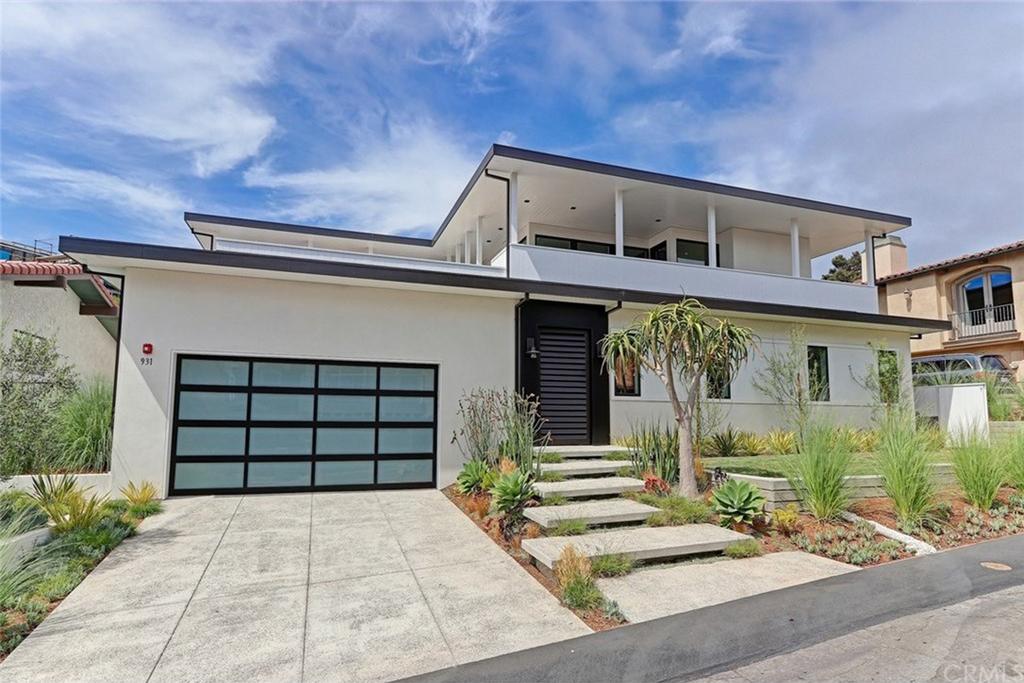
Of the sales closing in this period, the new Hill Section build at 931 Duncan Place (5br/5ba, 4920 sqft.) stands out.
Yes, it compiled 289 DOM over 2 listings. It sold 1 year and 10 days after its market debut.
Yes, the sale price was $1M under the start price.
But you can also focus on the positive: $4.775M looks like a pretty good deal for new construction with ocean views.
At $970/PSF, it's also actually lower than the PPSF for another recent sale on the same street: 1025 Duncan Place (4br/5ba, 4160 sqft., $4.050M, $974/PSF), and that comp wasn't even brand new. On-market comps are running in the $1,200/PSF+ range.
 The $4.775M sale is also one of the top 5 sales of 2017 in the Hill Section, and that's up against some incredible competition ($7M, $9M and $20M).
Finally, the sale helps to wrap up what had been a sluggish year on "Place" streets (alleys). (See "Some 'Places' Are Tougher than Others.")
The value was always there.
Duncan Place isn't the worst "alley street," with nice homes on both sides. The views are real and the build was innovative and cool. It just took time for people to come to appreciate it.
Word is, after all the time that passed for 931 Duncan Place on the market, once there was one offer in, there were three. Funny how that works.
Here's the rest of our local real estate market update report for the period ending 10/15/17:
- 94 active listings as of 10/31/17 (-14) --> and 86 here, one week later
- 77 SFRs (-10)
- 17 THs (-4)
See the inventory list as of 10/31/17 here, or see the MB Dashboard for up-to-the-minute data.
Active listings by region of Manhattan Beach in this report:
- Tree Section: 24 actives (+1)
- Sand Section: 47 actives (-10)
- Hill Section: 8 actives (-1)
- East MB: 17 actives (-2)
We're also providing a report on closed sales by region of MB.
Sales data, including PPSF for all properties, are organized by sub-region of Manhattan Beach.
Here's a link to the spreadsheet: "MB Pending/Sold as of 10/31/17."
Please see our blog disclaimer.
Listings presented above are supplied via the MLS and are brokered by a variety of agents and firms, not Dave Fratello or Edge Real Estate Agency, unless so stated with the listing. Images and links to properties above lead to a full MLS display of information, including home details, lot size, all photos, and listing broker and agent information and contact information.
Based on information from California Regional Multiple Listing Service, Inc. as of May 3rd, 2024 at 2:45pm PDT. This information is for your personal, non-commercial use and may not be used for any purpose other than to identify prospective properties you may be interested in purchasing. Display of MLS data is usually deemed reliable but is NOT guaranteed accurate by the MLS. Buyers are responsible for verifying the accuracy of all information and should investigate the data themselves or retain appropriate professionals. Information from sources other than the Listing Agent may have been included in the MLS data. Unless otherwise specified in writing, Broker/Agent has not and will not verify any information obtained from other sources. The Broker/Agent providing the information contained herein may or may not have been the Listing and/or Selling Agent.


