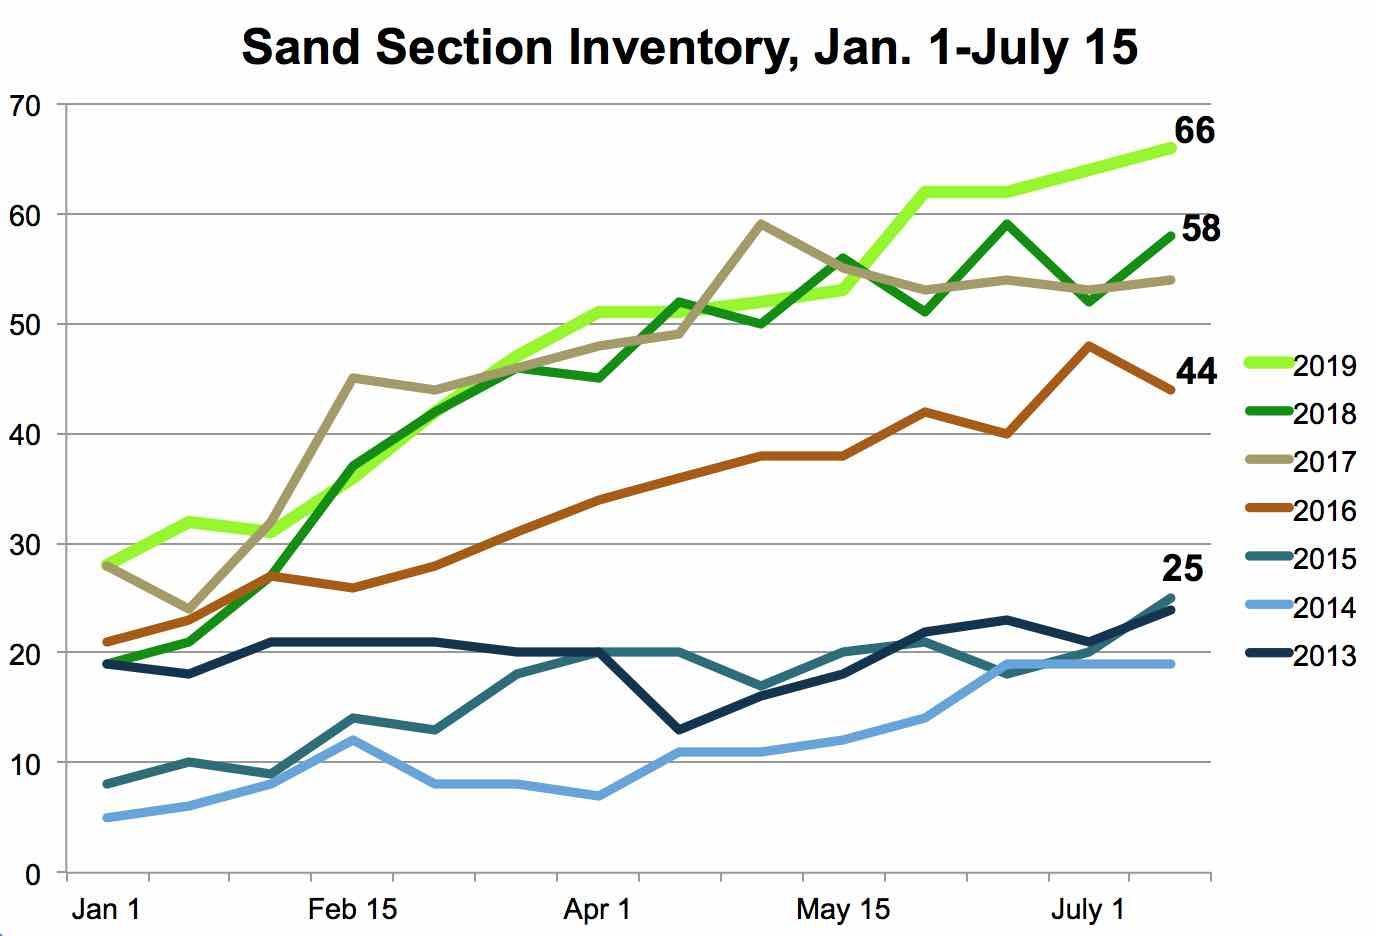
 Sand Section inventory hit a new high for recent years at mid-month this month.
Overall, active inventory dropped a bit (-2) citywide from July 1, but you can see that continuing movement upward by the beach.
This will naturally lead you to the next logical question about the Sand Section: If inventory is…
Sand Section inventory hit a new high for recent years at mid-month this month.
Overall, active inventory dropped a bit (-2) citywide from July 1, but you can see that continuing movement upward by the beach.
This will naturally lead you to the next logical question about the Sand Section: If inventory is growing, how are sales going?
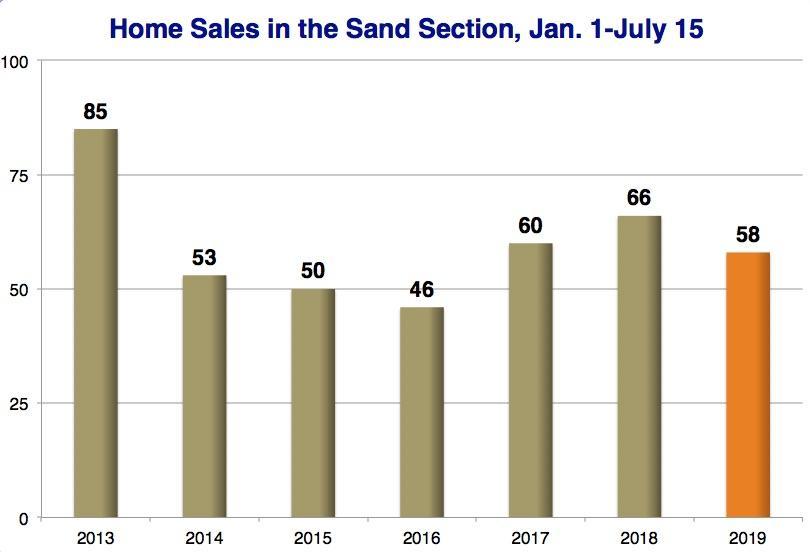 But as our second chart shows, that's not such a bad story overall.
In this same time period, first of the year through July 15, we had 58 sales close in the Sand Section, down from last year, but 4th best out of the last 7 years, and we don't recall any cries of panic in those past years.
Look back at 2013, though... wow, 85 sales in the comparable period. You couldn't keep a house on the market then!
To be fair, the story behind higher inventory this year is almost "equal opportunity."
Only East Manhattan has fewer homes for sale right now than last year, when the total citywide was 104 compared to this year's 130.
The Tree Section (21) and Hill Section (20) are both just about double last year's totals at this time of year, though neither of those numbers is all that large in itself.
We were going to fish for some interesting Sand Section sales from this period to feature, but it turns out, there were none closing between July 1-15.
But we can point to 3 Sand Section listings that found buyers during this period:
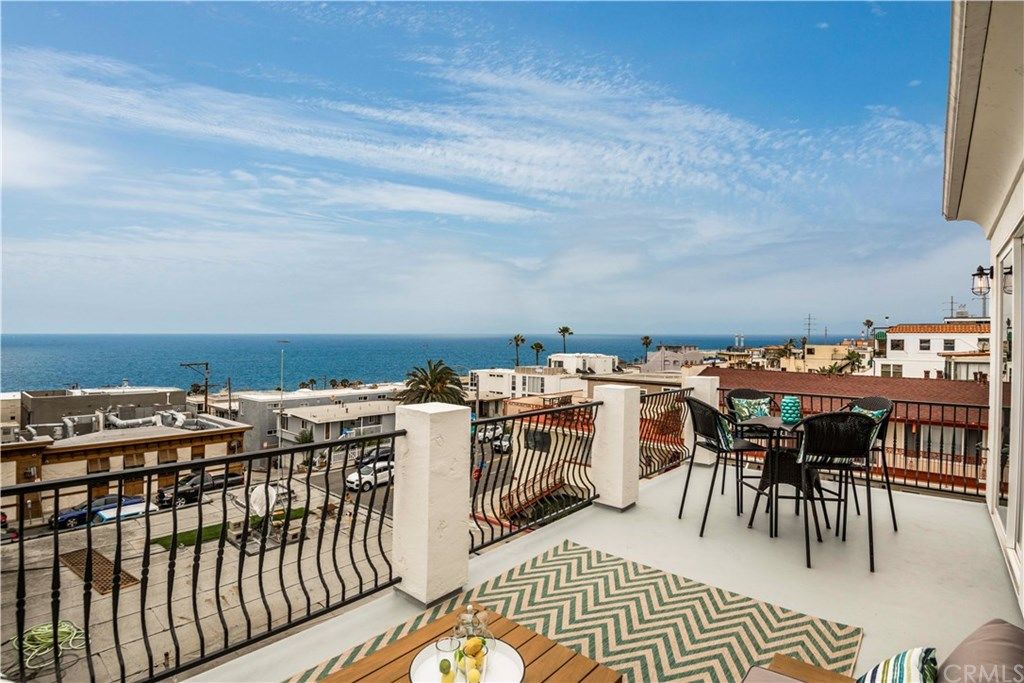
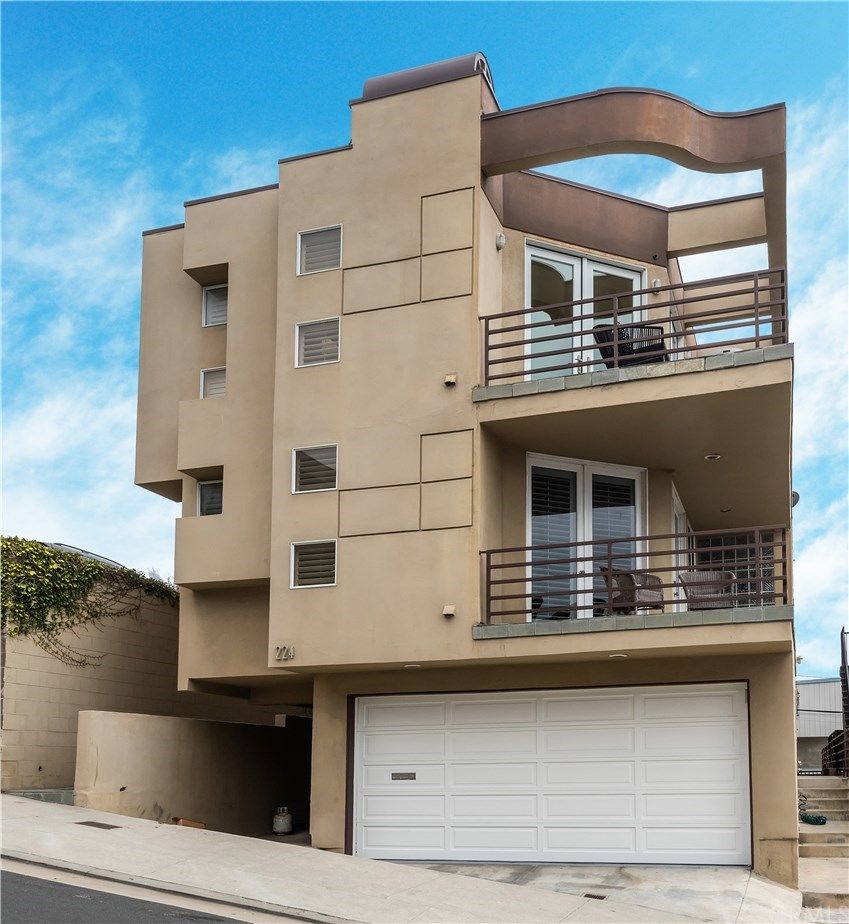 224 14th (4br/4ba, 3310 sqft.), an early-90s oversized TH right in the thick of downtown that wants updates.
This one found a buyer very quickly after listing at $3.499M, and bravo for that.
Someone was readily able to see the upside to all that space, some ocean views and a quite literally "walk to everything location."
Sometimes, a remodel-in-waiting is hard for people to picture. Not so here.
 Also, an SFR in El Porto with huge, unblocked ocean views over the local surf shop at 3805 Crest (3br/3ba, 1900 sqft.) came and went super fast, listing at $2.095M and lasting less than 2 weeks.
(Speaking of big views, if you are looking for that, we know of a Sand Section property off-market worth discussing. Email Dave: dave@edge-rea.com).
And a 1980s Strand condo at 2522 The Strand (3br/3ba, 2650 sqft.) fell out of escrow and back in during this period, last asking $5.399M.
Here's the rest of our local real estate market update report for the period ending 7/15/19:
- 130 active listings as of 7/15/19 (-2 from 6/30/19)
- 103 SFRs (-3)
- 27 THs (+1)
See the Inventory list as of 7/15/19 here, or see the MB Dashboard for up-to-the-minute data.
Active listings by region of Manhattan Beach in this report:
- Tree Section: 21 actives (-7)
- Sand Section: 66 actives (+2)
- Hill Section:20 actives (+1)
- East MB: 23 (+2)
We're also providing a report on closed sales by region of MB.
Sales data, including PPSF for all properties, are organized by sub-region of Manhattan Beach.
Here's a link to the spreadsheet: "MB Pending/Sold as of 7/15/19."
Please see our blog disclaimer.
Listings presented above are supplied via the MLS and are brokered by a variety of agents and firms, not Dave Fratello or Edge Real Estate Agency, unless so stated with the listing. Images and links to properties above lead to a full MLS display of information, including home details, lot size, all photos, and listing broker and agent information and contact information.


