There's just a little bit left of this year's market, perhaps a busy October before things calm down.
And we could use a little rally.
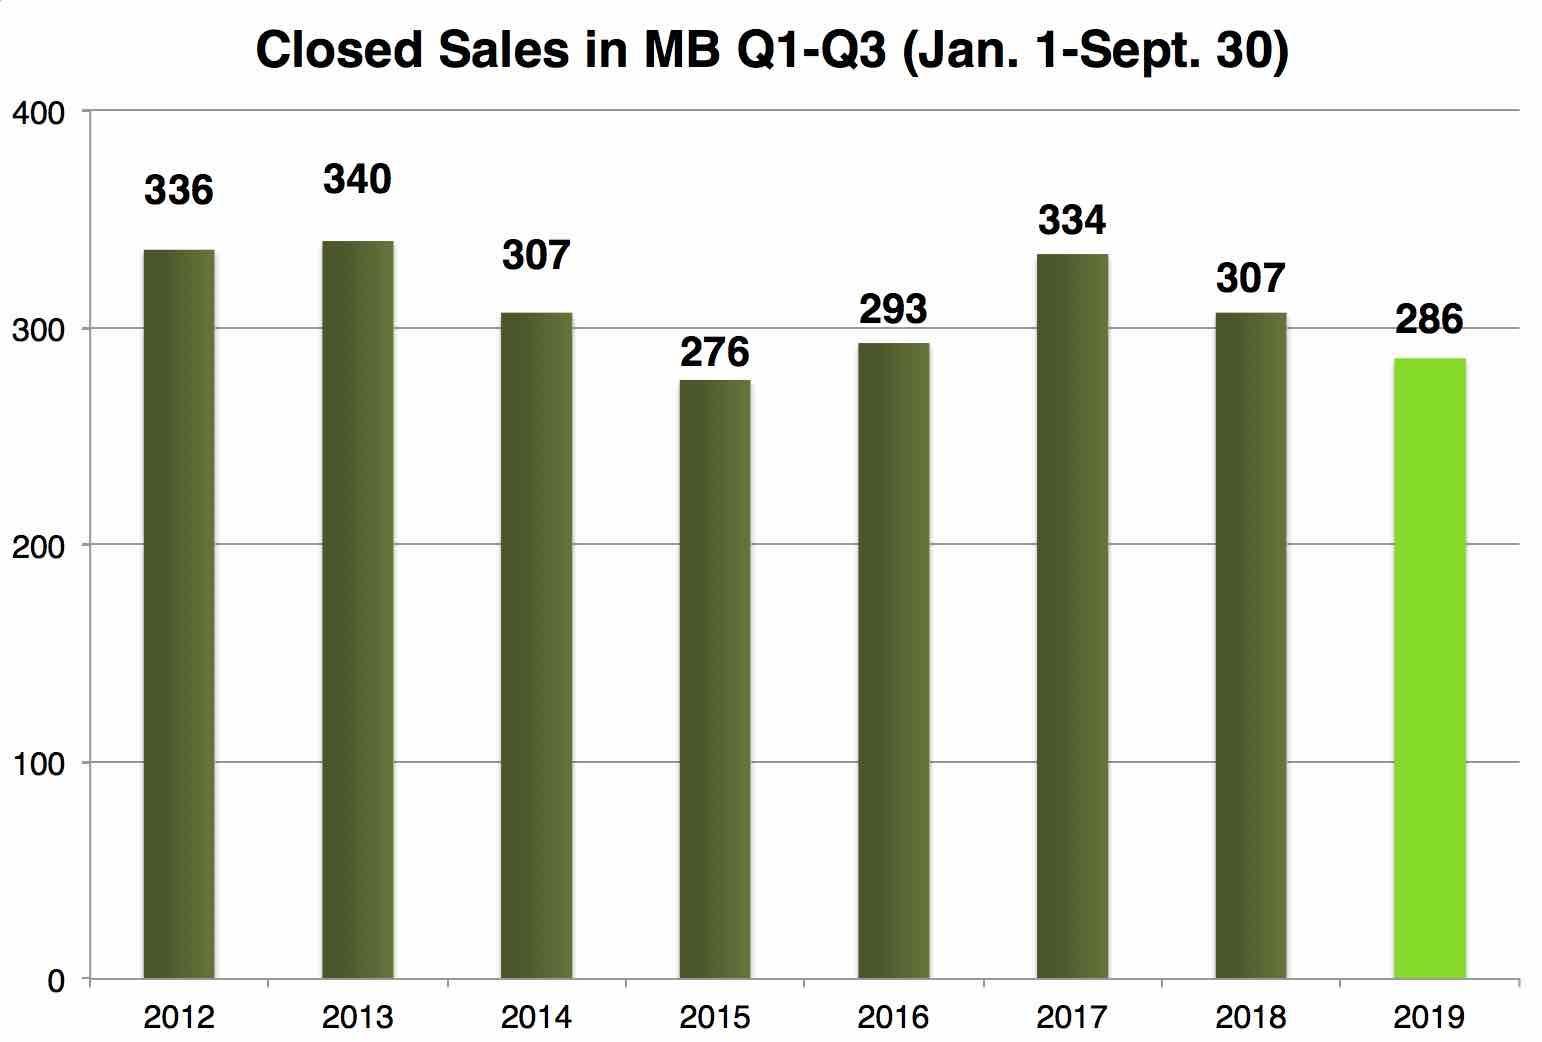 That's because sales totals for the year so far are now second-lowest of the last 8 years.
The 286 sales from Jan. 1-Sept. 30 are no small potatoes.
Those nearly 300…
There's just a little bit left of this year's market, perhaps a busy October before things calm down.
And we could use a little rally.
That's because sales totals for the year so far are now second-lowest of the last 8 years.
The 286 sales from Jan. 1-Sept. 30 are no small potatoes.
Those nearly 300 sales represent almost $1.6 billion in sales of local real estate over 9 months.
But we're down 7% in the number of sales year-over-year, much like how Q1-Q3 2018 saw an 8% drop from that super fantastic 2017. And we've got fewer sales in the first three quarters than we saw in 2016, a year which felt wobbly, though of course 2017 rocketed ahead just after.
Just as there is a mild downward trend in the sales volume this year, measured by the number of homes, there is also a drop in the year-to-date total amount spent on local homes.
 Check out this graph of dollar volume for local home sales spanning the same 8-year stretch of time.
We don't often cite dollar volume for comparisons, because with home price increases over time, the dollar volume changes can be misleading.
However, for the period of 2017-2019, prices have been relatively similar.
So that means comparing at least these past three years' worth of data should be valid. And the story isn't pretty if you only look at three years.
A dropoff from $1.925 billion to $1.576 billion for Q1-Q3 2017 to 2019 is a drop of 18%.
Sure, we had to come down from that "sugar high" year of 2017, but this is quite a drop. It's also a 10% drop from 2018 to 2019, meaning the dollar volume drop is a bit greater than the percentage drop in the number of sales.
On the positive side, 2019's sales volume is the third-best in history for Q1-Q3. (Whoops, did we bury the lede?)
Take your silver linings when you can get them.
Here's the rest of our local real estate market update report for the period ending 9/15/19:
- 130 active listings as of 9/30/19 (+4 from 9/15/19)
- 104 SFRs (+3)
- 26 THs (f+1)
See the Inventory list as of 9/30/19 here, or see the MB Dashboard for up-to-the-minute data.
Active listings by region of Manhattan Beach in this report:
- Tree Section: 26 actives (-2)
- Sand Section: 63 actives (+6)
- Hill Section:14 actives (-2)
- East MB: 27 (+2)
We're also providing a report on closed sales by region of MB.
Sales data, including PPSF for all properties, are organized by sub-region of Manhattan Beach.
Here's a link to the spreadsheet: "MB Pending/Sold as of 9/30/19."
Please see our blog disclaimer.
Listings presented above are supplied via the MLS and are brokered by a variety of agents and firms, not Dave Fratello or Edge Real Estate Agency, unless so stated with the listing. Images and links to properties above lead to a full MLS display of information, including home details, lot size, all photos, and listing broker and agent information and contact information.
Based on information from California Regional Multiple Listing Service, Inc. as of May 2nd, 2024 at 8:31pm PDT. This information is for your personal, non-commercial use and may not be used for any purpose other than to identify prospective properties you may be interested in purchasing. Display of MLS data is usually deemed reliable but is NOT guaranteed accurate by the MLS. Buyers are responsible for verifying the accuracy of all information and should investigate the data themselves or retain appropriate professionals. Information from sources other than the Listing Agent may have been included in the MLS data. Unless otherwise specified in writing, Broker/Agent has not and will not verify any information obtained from other sources. The Broker/Agent providing the information contained herein may or may not have been the Listing and/or Selling Agent.


