Though the bell rang nearly 18 months ago and the Manhattan Beach real estate market began to heat up, median price data never quite told the story.
By year end 2012, median prices in MB were flat. West of Sepulveda SFR prices were up just 1.5% year-over-year. (See this post on 2012 data citywide, and this post about west of Sepulveda only.)
Now it's different.
Depending on your time scale, you can now see upward trends of 10%, or much more, in MB.
Out of 4 data slices we'll present below, 3 of 4 show current median prices to be the highest in 5 years, taking us all the way back to the doldrums of 2008-09 and rising to new modern peaks.
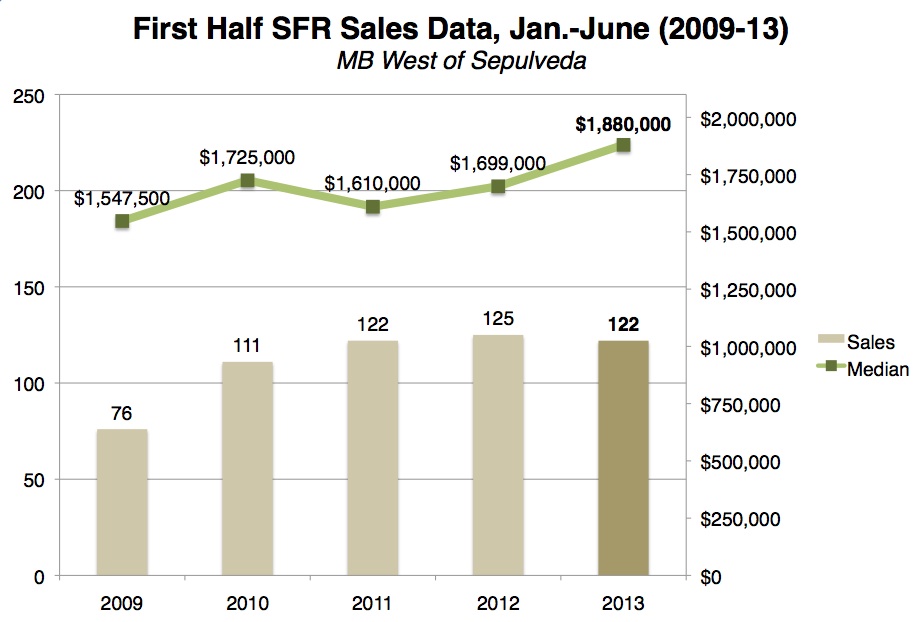 Let's start with the most amazing numbers. First is the median price for SFRs west of Sepulveda.
Using the narrowest window of time we could justify, we compared the first 6 months of results from 2009-2013, Jan. 1-June 30 of each year.
This year, the median price for SFRs west of the highway was $1.880M for the first half of the year.
It's a big number in its own right, and a notable jump of almost 11% over 2012, and 17% over 2011.
Sales totals for each of these past 3 years years were nearly identical to this year's 122 closed sales.
The jump from a very poor year, 2009, was almost 50 sales and more than 21% in the median price. Hello, recovery.
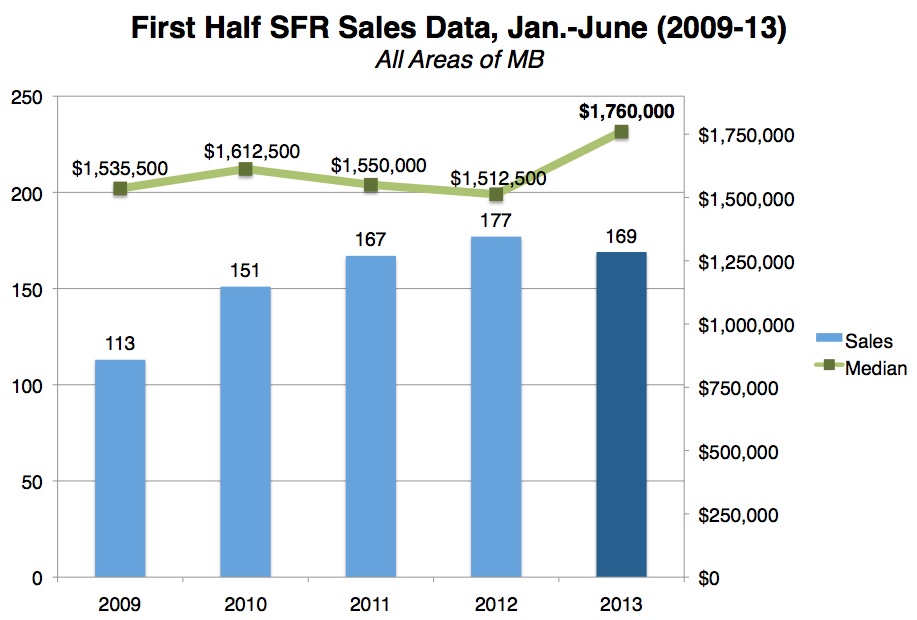 Now, second, the story for the first 6 months citywide is actually more amazing in parts.
Looking at all sales of SFRs in MB citywide, the jump in median price is 16% from 2012 to 2013, comparing the January to June period for each year.
The number of sales for 2013 was down a trickle from 2012, but still nearly constant for each of the years 2011-2013, at around 170 sales.
That citywide median price was $1.760M. Most of the past few years, the median price began with a 1.5.
We have been very, very skeptical of claims we've heard over the past year-plus that our market is up 15% in a short time frame.
For the first time, we can see data saying yes, that's so.
Bonus facts: Curious what the "median house" was for this period? Citywide, that was 1312 Walnut, sold for $.1760M, the subject of a bidding war that we chronicled in "Walnut Shocker." West of Sepulveda, it was 2009 Elm, a completely straightforward 4br/3000-ish sq. ft. home referenced in "Average Family Homes: $1.9M."
From those steep jumps on 6-month data sets, the rest of the story is still impressive.
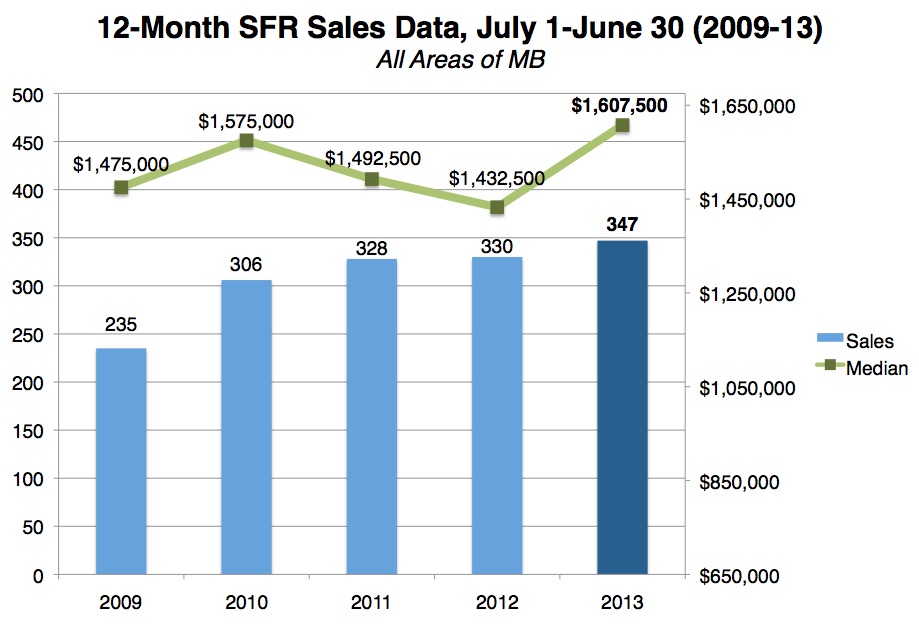 When we lengthen the time periods from to look at 12 months instead of 6, we see some flattening out of this year's first-half data for west-of-Sepulveda SFRs, but the citywide numbers still jump. (That's opposite of what we often see – usually west of Sepulveda values are higher and rise faster.)
The year-over-year data citywide show a remarkable jump of 12% in the median price for SFRs year over year. The actual numbers are even more amazing: From $1.432M last year to $1.607M this year, a boost of $175K.
Even if you didn't sell, it was a good year to be sitting on your property.
(Yes, that dip from 2011-2012 is a surprising finding, but the data don't lie, and we re-checked them. Sometimes the mix of what sells can really influence the median price reports. In this case, the dip in 2012 makes the rise in 2013 all the more impressive.)
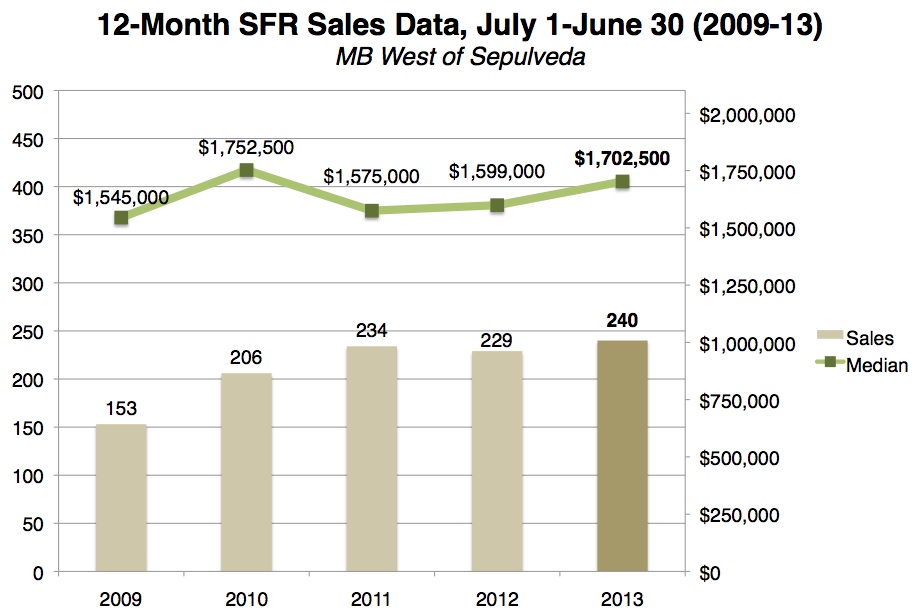 The numbers west of the highway are good, too, though the median price really flattens out.
On the 6-month scale, the median is nearly $1.9M. On the 12-month scale, it's just over $1.7M. That's a big swing, 10%.
And here the story has its own wrinkle. The 2013 full-year median price is still lower than the 2010 median for homes west of Sepulveda.
There was something in the mix from Q3 2009-Q2 2010 that boosted the median notably to over $1.750M. So at $1.702M now, we're still shy of a peak hit recently.
Look past that blip, and you can still say this year's median at $103K above last year's, +6%. Still plenty good.
It's often the case that longer time spans mean flatter results. But what we see now in the 6-month data for Manhattan Beach suggests that the full-year data set for 2013 is going to blow away prior years.
That's what it looks like here, just over a week into Q3. We'll see how it plays out.
-----------------------------------
Quick explanatory note: The years given on the charts for each of these 12-month periods reflect the second half of the prior year plus the first half of the current year. That means, for example, that the 2013 data reported here are made up of July 1, 2012 through June 30, 2013. The 2009 data include the last part of 2008. Probably that was clear, but we wanted to be sure!
It's also worth noting that sales volume for the 12-month period ending June 30, 2013, was the highest we've seen in the past 5 years.
That's saying something, given how low inventory has been for many months. (And yes, there are off-market sales, too, that don't get reported on the MLS and don't go into these data.)
If we pull the curtain back further and look back 10 years, we believe you'll see that sales totals are actually far below prior go-go years. And wouldn't you like to know where the medians wound up? Next data dive!
Please see our blog disclaimer.
Listings presented above are supplied via the MLS and are brokered by a variety of agents and firms, not Dave Fratello or Edge Real Estate Agency, unless so stated with the listing. Images and links to properties above lead to a full MLS display of information, including home details, lot size, all photos, and listing broker and agent information and contact information.


