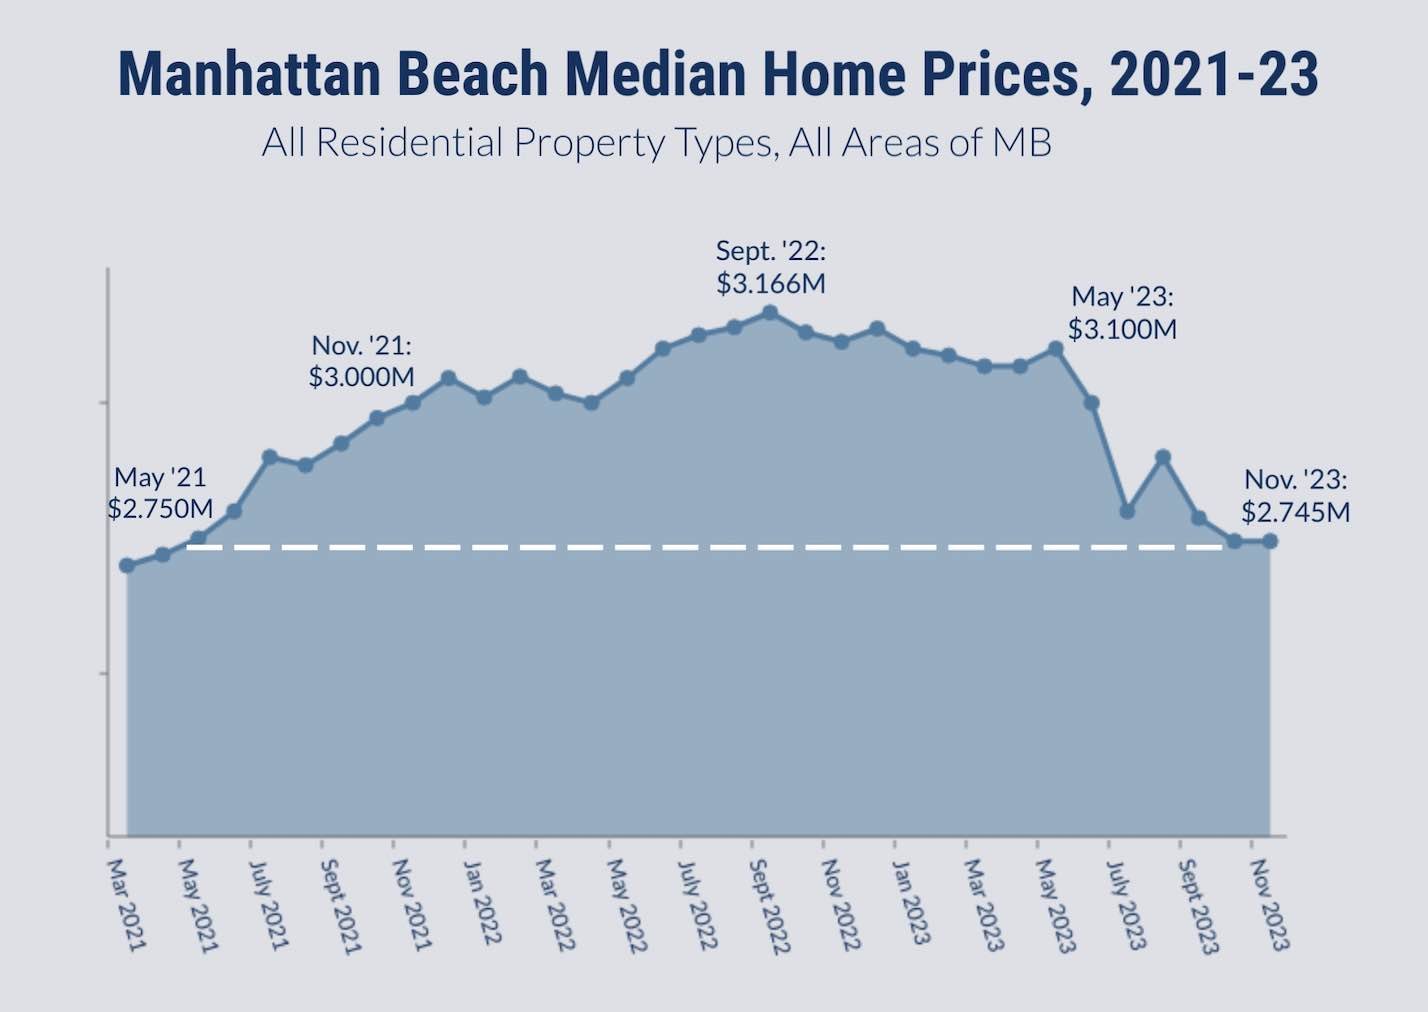
After holding steady for the first half of 2023, the median home price for Manhattan Beach has dropped substantially and stayed down for the last part of the year.
The median price skidded to $2,745,000 for both October and November this year, a drop of $367K and 11.8% (call it 12%) over a single 12-month period.
We'll have a lot more discussion, comparison and context below, but first, the ugly truth in a chart:
All median price data here and in the charts below come from a full, running 12-month set of data. In other words, we're looking at median prices for sales occurring between Dec. 1, 2022 and Nov. 30, 2023, in every case.
We first called attention to slippage in the local median price in our end-of-July market update. At the time, the median was at $2.800M, down $300K from just a couple of months before. If you want to look on the bright side, the median has only dropped $55K since then.
With this latest downward adjustment, the median price for Manhattan Beach homes has returned to a level last seen in May 2021.
How Does Manhattan Beach Compare?
Now, you may assume: If Manhattan Beach is suffering like this, probably lots of other towns are, too?
Not really.
The year-over-year drop in the median price in Manhattan Beach is substantially the worst in the South Bay, three-and-a-half times the little slip of -3.3% for Redondo Beach.
The picture improves quite a bit if we drop condos and townhomes out of the data, and compare median prices for single-family homes, only. By the SFR measure, Manhattan Beach is outperforming the two other beach cities, and doing better than the South Bay as a whole. All of that data is in this chart:

Take note: In this chart and the others below, the dark blue bar always represents the median price for the full market, and the lighter blue bar represents the median for single-family homes only.
To recap what the chart is telling us, Manhattan Beach's median price drop of 11.8% is far more substantial than the drops in Hermosa, Redondo or the Palos Verdes area. Torrance stands out for having seen a 1.4% increase in its median price. (Its market is comparatively en fuego, if you didn't know.) The South Bay as a whole unit is actually down 5.2% in this sampling, which includes only the five cities and areas named on the chart.
The story changes quite a bit when we look only at single-family homes. Manhattan Beach is still down substantially at -6.3%, but now that's better than the other beach cities (Hermosa, -8.7%; Redondo, -7.1%), and better than the South Bay as a whole (-8.0%). (Two weeks ago, we wrote about one single-family house that sold in May 2022, and again in Nov. 2023, for 6% less – one form of validation to the market-wide change in SFR values.)
What if we look outside the bubble? Maybe some Orange County beach cities?

This brings us a torrent of mixed data.
Laguna Beach was the only city we could find in LA or Orange County that is remotely comparable to Manhattan Beach that had a 10% or greater drop. In this case, it was precisely a 10.0% drop in its overall median price. (Please do not write to us about the many differences between Laguna and Manhattan. We did say "remotely comparable.")
Both Newport and CDM are essentially flat on median price year-over-year, while Dana Point and San Clemente saw modest increases, nearly 5% for Dana.
Laguna was still lagging when we focused on SFRs only, and Dana went from biggest winner to biggest loser. (Go figure.) Newport and San Clemente were in the black.
How about some luxury markets in Los Angeles County?

Once again here, we have some really mixed data, and wild variations when looking at SFRs only.
Pacific Palisades took the biggest hit on its market-wide median price, dropping 7.8% year-over-year. We looked up several big-name L.A. areas with substantial sales volume and nominally comparable home prices to compare with Manhattan Beach, but this was the only one with a really notable drop – and MB's drop is 4% steeper.
Beverly Hills, Brentwood and San Marino all saw upticks in their market-wide median prices, with Brentwood performing best at +3.4% year-over-year. (Dave and the Edge office actually sold a listing in Brentwood this year, selling quickly and well over asking. So that tracks.)
Look how fortunes change, however, when we focus on SFRs.
Suddenly, La Canada's worse off than the Palisades, Beverly Hills goes from black to deep red (-12%), and Brentwood's gain is a more modest 1.5%.
Considering Reasons for Median Price Drops
The first problem confronting almost all real estate markets is gravity. Prices were lifted to the stratosphere and beyond by cheap money in 2020-22 as a consequence of pandemic-inspired monetary policy.
Markets may be correcting unevenly still, as both inventory and sales volume are way, way down throughout SoCal. Fewer listings has generally meant more competition and more stable median prices, but that seems only to work for a while.
We collected data on every market referenced above as to sales volume, but it's almost too much to chart. It's just as easy to tell you: Closed sales are down around 25% almost everywhere, year-over-year, with some areas just doing just a little better, and some just a little worse. Manhattan Beach had 26% fewer sales in the most recent 12-month period than in the year prior.
The question you really want to tackle is: Why did MB's median price drop?
The simple, statistical answer is: More homes were sold at lower prices than at higher prices.
We dove into the data a bit deeper, and found two standout numbers.
First, we're seeing only about half the usual number of condos/townhomes among the mix of sales citywide. On a percentage basis, 89% of the properties sold in Manhattan Beach from Dec. 1, 2022 to Nov. 30, 2023 were single-family homes, with just 11% being condos or townhomes. In the 5 years prior, the percentage of condos or townhomes ranged from 19-23%.
We also noted that the share of homes sold in the price range of $3.000M-$5.999M dropped from 43% in each of the prior two years to just 33%.
This means that in the latest data, we have many fewer condos/townhomes, and properties priced between $3M-$6M.
We're only talking about 25 properties here that are at the root of each 10% change in the mix of sold properties. It seems that some "missing" Sand Section townhome sales could explain what looks like a market-wide drop.
But the numbers are what they are. Just because an engineer wants to call something a "rapid unscheduled disassembly" doesn't mean people have not seen a rocket blow up.
We've seen our market come in for a landing, not blow up.
Buyers are seeing, and will expect, lower prices as next year's market takes shape. We'll see who's right.
-------------------------------------------------------------------------------------------
Nerdy notes:
Chart data comes from the California Regional Multiple Listing Service, Inc., InfoSparks © 2023 ShowingTime.
All charts custom crafted by Dave Fratello for MB Confidential, and copyrighted.

